
2025 Begins with a Normal Yield Curve – But Where is the Risk?

By Michael Gerbick; President, Young & Associates

On Wednesday, January 29, 2025, Jerome Powell and the Federal Open Market Committee (FOMC) decided to maintain the target range for the federal funds rate at 4.25 – 4.50 percent after three successive cuts totaling 100 bps in September, November, and December. There continues to be heightened attention and focus on the yield curve, and for valid reasons, as the curve’s shift has been dramatic in recent years.

The chart below shows the yield curve at five different points in time from January 2022 to Tuesday, February 18, 2025. The shape of the curve has gone from normal to inverted and now back to normal. Looking at a few different US Treasury Bond maturities over the last 14 months, you can see the one month yield has decreased over 120 bps and the 20 year has increased over 60 bps! Each rate curve shape and elevation imply different opportunities for your balance sheet. A more asset-sensitive and positive gap on a balance sheet may be more attractive for earnings in the short term and helpful when the Fed was raising rates in 2022 and 2023.  A more liability-sensitive and negative gap on a balance sheet may be more attractive for earnings in the short term as the Fed reduces rates. Your ALCO is likely well-versed in these shifts and has been managing these drastic movements and their impact on the Bank’s overall strategy.

The normal yield curve indicates improved expectations for economic growth in the years ahead. That said, there is also caution for inflation. When the Fed began rate reductions, there were discussions regarding more cuts totaling 100 bps by year end 2025, then these ambitious views have shortened to perhaps two cuts of 25 bps each. The yield curve is still elevated from what it was several years ago and the Fed Funds rate is higher than the previous cycle’s peak of 2.25 – 2.50 percent in 2018-2019. The consumer is more savvy than they were at that time as well.

At the end of 2024, we spent time interviewing some of our community banker colleagues to gain a pulse on what they are talking internally about in their ALCO meetings concerning interest rate risk. As expected, there is an overall sense of relief to have a normal yield curve instead having to manage to the inverted one of recent years. There is still an overall sense of caution headed into 2025 for many reasons, with two key factors briefly discussed in the following sections.

Cost of Deposits

Community banks may not realize the full impact of the Fed’s rate reduction in their cost of deposits. Given the continued elevated competition for deposits and the more savvy consumer, community banks may find their deposit rate offering slower to adjust than the Fed’s rate movements and some may see their interest expense actually increase in 2025. There may also be migration to more longer term duration CDs (movement from less than 6 months to 1 year or more). Yes, longer term CDs will keep the deposit costs higher than non-maturity but will create welcomed funding stability for the bank. Continued focus on the bank’s deposit makeup and shifts are necessary. Staggering the CD maturities will be critical for community banks to manage this new environment so as to maintain adequate liquidity levels as CDs mature and consumers make a choice to reinvest, migrate to shorter term or perhaps withdraw their funds.

Investments

Many investments were made by community banks with PPP funds and other excess liquidity in a low rate environment back in 2021. The Fed raised rates 550 bps and many of those investments contributed to a significant amount of unrealized loss. Now, the Fed cut rates 100 bps and the yield curve is no longer inverted. The rates are still elevated and there are still a significant amount of investments on community banks’ balance sheets with unrealized losses. The chart below shows the fair value of investment portfolio expressed as a percent of the amortized cost of the investment portfolio over the last four years for commercial banks.

You can see all three asset sizes over the last four years have a similar trend line. Consider a bank having $100MM in their security portfolio, it is likely its portfolio is currently $7-$10MM underwater. This changes each day as these investments continue to reprice and mature over time.  As they do, bank management is faced with how best to serve its bank either in reinvesting short-term or long-term within their investment portfolio or funding higher yielding loan growth opportunities. Each has liquidity and capital implications that must be considered.

Conclusion

Community banking is resilient and the conversations with community bankers reveal their drive to prepare and plans for managing risk in 2025 and beyond. ALCO and Boards of Directors should continue their sharp focus on managing interest rate risk.  If the deposit competition is fierce for your Bank and interest expense in 2025 is expected to be elevated, then focus on what is within your bank’s control. On the asset side of the balance sheet, consider paying attention to the loan and investment portfolios and when they are repricing, what additional loan fee income can be generated, revisiting discussions and confirming the types of loans the bank is comfortable making.

When considering interest rate risk, confirm your bank’s risk profile and always remember to stay within the Board approved risk parameters. Your bank’s balance sheet may have experienced significant change away from a neutral risk position given the economic environment in recent years. If you have found your bank is outside the risk parameters, discuss strategies with your Board that are designed to get the bank back within acceptable risk thresholds.  Always be clear with the Board on expectations and inform them we may not be able to fix this overnight.  One banker said it best when providing advice for community bankers trying manage the interest rate risk of the bank, “Always manage the bank’s IRR to a better position, even if getting to that position takes years …don’t get ahead of your skis and try to do it all in one day.”

Lastly, thank you to those community bankers that spent their time discussion IRR and sharing their insights in the interest of helping other community bankers.

If you’d like to hear more about our ALM services, specifically interest rate risk and liquidity risk reviews, please reach out as we would be happy to discuss and assist.

Market Shifts & Margin Pressures

By Michael Gerbick, President, Young & Associates

On Thursday, November 7, 2024, Jerome Powell and the FOMC (Federal Open Market Committee) announced a 25 basis point (bp) interest rate reduction of the federal funds rate just after they announced a 50 bp cut in September.  September’s rate reduction was the first time since March 2020, the Fed has cut rates.  Consider the last several years regarding interest rates: rates dropped to zero in the face of a pandemic, rates skyrocketed 550 bps resulting in an inverted yield curve spanning years, and now another shift in monetary policy.

To provide a visual display of this environment, please view the yield curve over the last few years and then just after the announcement of the latest rate cut on November 7, 2024. Between July 2022 and August 2024, the 10-year bond yield was less than the 2-year yield indicating an inverted yield curve. You can see in the November 8, 2024 curve, the yield on the 2-year bond below the 10-year. The shift in the yield curve has been incredible. Consider the decisions made around each of these points in time at your institution.

US Treasury Yield Curve

This rate environment and the decisions made within it are impacting banks everywhere, especially community financial institutions. Decisions on how best to retain and grow deposits have impacted balance sheets and income statements during this time. It is well-known consumers were placing their money in certificates of deposit (CDs) as rates rose and continued to move their funds to these higher yielding deposit accounts, even after the Fed’s last hike in 2023. The charts below utilize call report information from S&P Global for commercial banks and reveal the deposit mix shift from non-maturity deposits and CDs from the last year. Segmenting CD deposit data from commercial banks by asset size, one can see the shift in the deposit mix for the community banks less than $1B has been the most significant.

CDs as % of Total Deposit Shift September 2023 to September 2024

These CDs will mature; the following chart shows the majority of these maturities will take place in the next year (+84%), with nearly 30% maturing by year end 2024.

% of CDs Maturing in 3 Months and 3-12 Months from September 2024

The deposit shift to CDs is not only more costly to community financial institutions, raising their cost of deposits and ultimately adding pressure to their Net Interest Margin, but they can also be more volatile than traditional non-maturity deposits with savvy depositors more willing to move their deposit relationship to the institution with the highest yielding return. In addition, the data in the charts show this deposit shift is more significant for the smaller community banks with less of an opportunity to reprice in the shorter term than the other community commercial banks.

Many of our community bank colleagues are very much aware of these rising costs and are actively pursuing all resources (including each other) on how best to manage this aspect of the balance sheet. In May 2024, the FDIC released its Annual Risk Review and in June 2024 the OCC released their Semiannual Risk Perspective both outlining significant trends and risks in the banking industry. Among the critical sections in each, the analysis of market risks stands out, particularly for community financial institutions. Both articles have common themes, I’ll break down some important insights from the reports and how they may impact your institution and its strategy in the coming months and years.

Liquidity, Deposits, & Funding: A Shifting Landscape

Reinforcing the analysis earlier this article, the OCC and FDIC both indicate 2023 saw an increase in the cost of funds for banks as community banks reacted to the rising rate environment and for more savvy consumers. For community banks, which typically have smaller balance sheets and lean heavily on customer relationships, the stability of insured deposits has been a positive. However, the growing trend of depositors seeking higher yields has led to a shift from traditional savings accounts to CDs and other high-yielding options.

This shift puts upward pressure on interest expenses, a trend community financial institutions are already feeling. In fact, CDs accounted for 26% of median of all FDIC bank deposits at the end of 2023, compared to 19% the previous year. To remain competitive and retain deposits, community banks are raising deposit rates, which in turn increases their cost of funds.

For community banks that have traditionally benefited from lower-cost deposits, this shift represents a double-edged sword—depositors are seeking better returns, but retaining those deposits requires higher costs. The challenge will be finding a balance between offering attractive rates to depositors and managing interest expenses.

Addressing Deposit Competition

To combat this competition, community financial institutions need to focus on differentiating the value they provide beyond rates. Here are some approaches you may find value in pursuing:

  • Tiered Deposit Products: Offering tiered-rate accounts for different deposit levels or durations can help incentivize customers to commit their funds for longer periods while minimizing the impact on your cost of funds.
  • Relationship Banking: Unlike larger institutions, community banks can leverage personal relationships with customers. Offering value-added services such as financial planning or personalized advisory services can deepen customer loyalty, encouraging them to keep their deposits with your institution even if competitors offer slightly higher rates. This applies to new lending relationships too, prioritize getting the customer’s deposit relationship as the new loan is established.
  • Community Initiatives: Reinforce your brand of being an active member of the community. Consider leveraging the relationship banking discussed above; partner with these businesses to sponsor local fundraisers together. Consider avenues to reinforce your commitment to the community with other members of the community. This can not only build loyalty but also emphasize the bank’s role in the community, creating a compelling reason for customers to stay and others to start a relationship with you.

Increased Reliance on Wholesale Funding

Liquidity pressures in 2023 forced banks, especially community institutions, to turn more heavily to wholesale funding to meet liquidity needs. This is especially concerning for community banks that have historically relied on stable local deposits. The FDIC report noted that liquid assets at community banks declined alongside loan growth, driving a reliance on wholesale sources to fund assets. By the end of 2023, 19% of total assets at community banks were funded by wholesale sources, the highest level since 2017.

Wholesale funding often comes with higher costs and introduces funding risk, particularly in periods of market stress. Community banks need to carefully manage this balance, ensuring they have access to cost-effective liquidity while avoiding over-reliance on wholesale sources that could pose risks if market conditions deteriorate.

Net Interest Margins & Interest Rate Risk

Margin Compression & Variability Among Banks

Both the OCC’s and FDIC’s report make it clear that NIM compression is a concern. Although the median NIM increased slightly to 3.45% in 2023, this masks the deeper issue: funding costs—particularly deposit rates—are rising faster than loan yields, minimizing the yield gains on the assets. Many community banks saw margin compression as the cost of funds outpaced asset yields.

In the FDIC report it is highlighted that smaller community banks with less than $100 million in assets generally fared better than others, with 70% of these institutions reporting higher NIMs comparing 2022 to 2023. This is likely due to their ability to maintain stronger liquidity positions and avoid the sharp increases in funding costs that larger institutions faced. However, even smaller banks are not immune to the challenges posed by rising interest rates, and they may find their NIMs under pressure in the coming quarters as deposit costs continue to rise.

Strategies for Managing the Squeeze

  • Balancing Deposit & Loan Pricing: The traditional method of managing NIM by lowering deposit rates or raising loan rates may no longer provide the same value it did in the past. Community banks can explore variable-rate loan products with rate floors, which allow for automatic adjustments as interest rates rise and have some protection as rates decline. This provides a hedge against rising funding costs.
  • Dynamic Pricing Models: Incorporating dynamic pricing strategies for both deposits and loans can help strike the right balance between growth and profitability. For instance, a Midwest community bank adopted a step-up CD product, which started with a competitive rate that increased over time, providing both flexibility for depositors and predictability for the bank’s funding costs.
  • Strategic Use of Securities Portfolios: To manage asset-liability mismatches, community banks can strategically deploy their securities portfolios. If the bank has excess liquidity, consider investing in current higher rate securities. Many banks invested in securities prior to the most recent rising rate environment and have unrealized losses. Although realizing significant loss on the sale of your securities is not ideal, banks should have discussions internally concerning their portfolio, payback period if a loss is realized and the most prudent path forward for their institution.

Interest Rate Risk Environment Remains High

For community banks, interest rate risk (IRR) has become an increasingly critical issue. The FDIC’s report points to the elevated share of long-term assets held by these institutions, which could constrain future NIM growth. As interest rates rose rapidly in 2022 and 2023, some community banks began selling off lower-yielding securities to reinvest in higher-rate assets. The OCC reports call out unrealized losses in held-to-maturity portfolios declined in the fourth quarter of 2023, but remained elevated at 11.5 percent. This security management strategy was mentioned earlier in this article and if implemented should be tightly monitored so as to minimize the impact and risk of any realized losses on those securities.

The OCC’s report discusses the uncertainty of the rate environment and depositor behavior prior to the Fed acting and reducing rates. It states:

Uncertainty regarding the rate environment and depositor behavior over the next 12 to 24 months increases the importance of stress testing and sensitivity analysis of deposit assumptions. Given uncharted depositor behavior and rate sensitivity observed during the recent increasing rate environment, prudent risk management would include interest rate risk and liquidity stress-testing scenarios that assume higher than expected deposit competition, resulting in higher-than-expected deposit pricing regardless of rate movement direction.

Well-developed assumptions are key to IRR management and modeling. With a declining rate environment community, banks may want to assume more conservative betas in their repricing assumptions.

Strategic Takeaways for Community Banks

So, what can community financial institutions do based on the data in the OCC and FDIC’s Reviews?

  • Diversify Funding Sources: The increasing reliance on wholesale funding is costly for community banks. Banks may focus on exploring alternative funding sources or solidifying relationships with local depositors may help mitigate future liquidity pressures.
  • Focus on Asset-Liability Management (ALM): With interest rate risk remaining high, it is critical for community banks to develop more dynamic asset-liability management strategies. Refining the ALM modeling deposit beta assumptions and monitoring the shift of the deposit mix can help to improve forecasts and reduce the risk of negative financial impact. In addition, reinvesting proceeds from lower-yielding securities at higher rates can help but must be carefully managed to avoid significant losses.
  • Manage Interest Expenses: Even with the Fed reducing rates a total of 75 bps in the last few months, the competition for deposits remains fierce, and many community banks will need to continue offering higher rates to retain customer funds. While this will delay the full impact of cost relief from the Fed’s rate reduction, thoughtful pricing strategies and maintaining a strong loan portfolio could help offset these expenses.

From Stress to Success: Stay Agile, Stay Informed

As community financial institutions adjust to the Fed’s 50 bps and 25 bps rate reductions and face the challenges outlined in both the FDIC’s 2024 Risk Review and the OCC’s Semiannual Risk Perspective, it is clear that agility and innovation will be key to success. The market risks—ranging from deposit competition and NIM compression to liquidity pressures—are significant, but with strategic thinking and proactive management, community banks can navigate these challenges and continue to thrive. With proactive strategies focused on liquidity management, asset-liability alignment, and cost control, community financial institutions can navigate these turbulent waters and position themselves for success in 2024 and beyond.

For community banks, the key takeaway is clear: stay agile, monitor funding costs closely, and adopt risk mitigation strategies that balance growth with stability. By doing so, these institutions can continue serving their communities and remaining resilient in the face of economic uncertainty.

For over 45 years, Young & Associates has guided community financial institutions through shifting market risks. Whether it’s capital planning, liquidity management risk reviews, or interest rate risk management reviews, our team is here to ensure your institution stays agile and ready to adapt to evolving market conditions. Contact us to learn more about how we can support your success.

CRE Stress Testing for Banks: A Crucial Tool in a Post-COVID World

By Jerry Sutherin, CEO at Young & Associates

Despite having limited requirements as defined by interagency guidance, the case can be made for requiring community financial institutions to have regular stress tests performed on their commercial real estate loan portfolios.

Emerging Challenges in Commercial Real Estate Lending

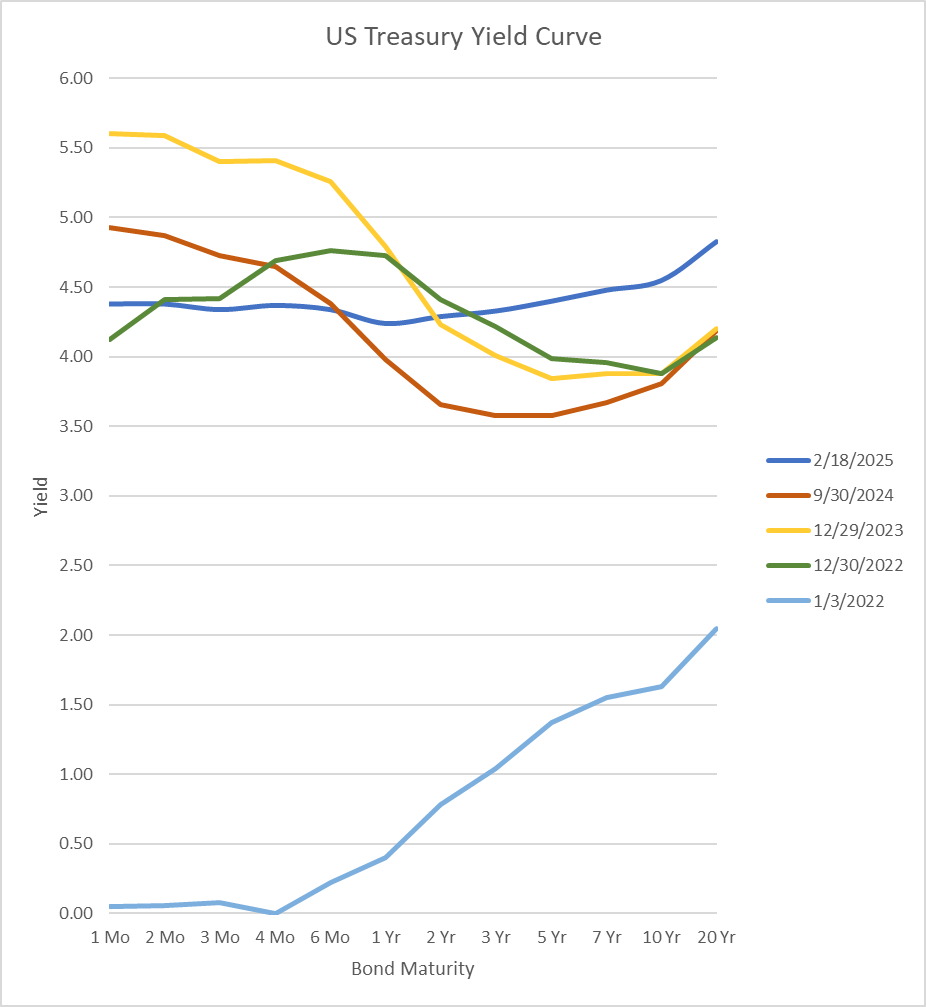
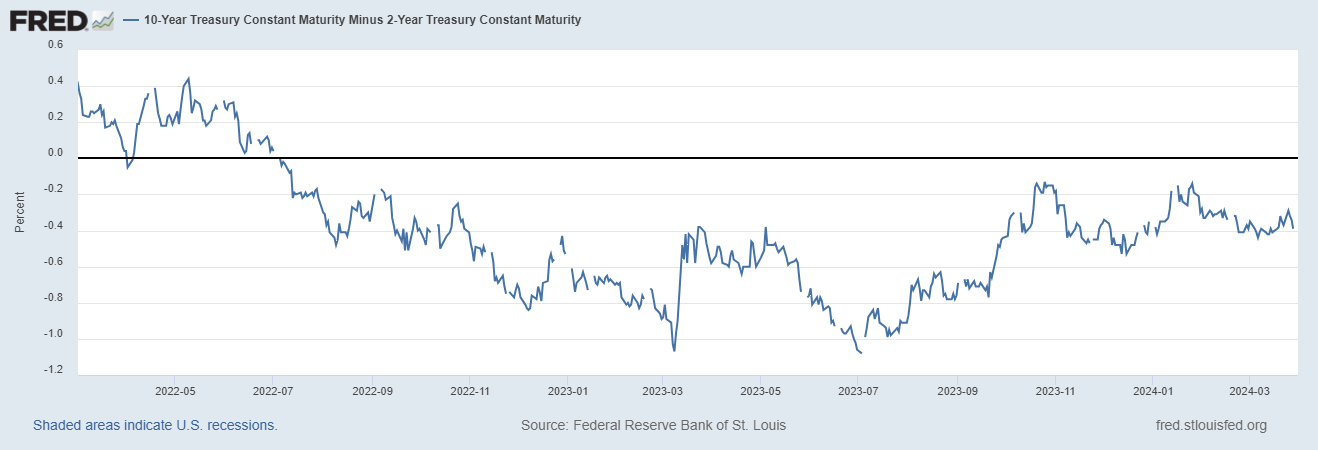
Recent post-COVID events have resulted in a heightened concern with regulators as it relates to commercial real estate. Most notably, interest rates have increased 525 bps from March 2022 through July 2023 and this correlates with the level of commercial loan delinquencies over that same period as noted in the chart below. This is further exacerbated the “work from home culture” and office vacancies increasing over the same period.

The ultimate impact on the commercial real estate sector is weaker NOIs, coverage ratios that are insufficient to meet loan covenants, higher Cap Rates, and lower valuations. For those loans locked into a lower rate, the issue now becomes; what happens when loans mature or reset? That is occurring now.

CRE Composition and Delinquency at US Banks Chart - S&P Global

Regulatory Expectations for Bank Stress Testing

Regulatory expectations for community bank stress testing initiatives have been set in both formal regulatory guidance and through more informal publications and statements. An interagency statement was released in May 2012 to provide clarification of supervisory expectations for stress testing by community banks.[1]

The issuance specifically stated that community banks are not required or expected to conduct the types of enterprise stress tests specifically articulated for larger institutions in rules implementing Dodd-Frank stress testing requirements, the agencies’ capital plan for larger institutions, or as described in interagency stress testing guidance for organizations with more than $10 billion in total consolidated assets.

OCC Guidance on Stress Testing Practices

However, in October 2012, the OCC provided additional guidance to banks on using stress testing to identify and quantify risk in the loan portfolio and to help establish effective strategic and capital planning processes.[2] The guidance reiterated that complex, enterprise-wide stress testing is not required of community banks, but also states that some stress testing of loan portfolios by community banks is considered to be an important part of sound risk management.

In the guidance, the OCC does not endorse a particular stress testing method for community banks; however, the guidance also discusses common elements that a community bank should consider, including asking plausible “what if” questions about key vulnerabilities; making a reasonable determination of how much impact the stress event or factor might have on earnings and capital; and incorporating the resulting analysis into the bank’s overall risk management process, asset/liability strategies, and strategic and capital planning processes.

The OCC bulletin also provides a simple example of a stress testing framework for community banks. In the summer of 2012, the FDIC also provided further guidance related to community bank stress testing in the Supervisory Insights Summer Edition.[3]

Interagency Guidance on Commercial Real Estate Risk

Perhaps the most significant piece of guidance related to loan portfolio stress testing for community banks is the 2006 interagency Concentrations in Commercial Real Estate Lending, Sound Risk Management Practices.[4] The continuing importance of and regulatory emphasis on this guidance was made clear in December 2015 when the interagency Statement on Prudent Risk Management for Commercial Real Estate Lending[5] was released, which reiterated the importance of the principles described in the 2006 CRE Guidance.

The 2006 CRE Guidance describes several important practices for effectively managing the risks associated with CRE lending, especially concentration risk. Portfolio stress testing of the CRE portfolio is described as a critical risk management tool for institutions with CRE concentrations.

Examiner Expectations for Portfolio-Level Stress Testing

While community banks have not been pushed to perform the enterprise-wide stress testing that the above guidance specifically states is not expected of them, examiner expectations for portfolio-level loan stress tests have continued to increase over time and are becoming more prevalent during a bank’s recurring exams. These expectations are centered on portfolios that represent significant concentrations and, given the perceived level of risk and the existence of the 2006 CRE Guidance, are therefore most focused on CRE portfolios.

A reasonable and well-documented approach to CRE portfolio stress testing, undertaken at appropriately frequent intervals such as on an annual basis, is the most effective way for community banks to meet examiner expectations and to contribute toward effective risk management of CRE concentrations.

Regulatory Criteria for CRE Concentration Risk

The guidance also states that strong risk management practices (with stress testing being one of the most important) and appropriate levels of capital are important elements of a sound CRE lending program, particularly when an institution has a concentration in CRE loans. The guidance then lays out the criteria regulatory agencies utilize as a preliminary means of identifying institutions that are potentially exposed to significant CRE concentration risk:

  1. Total reported loans for construction, land development, and other land represent 100% percent or more of total capital, or
  2. Total commercial real estate loans (as described above) represent 300% or more of the institution’s total capital, and the outstanding balance has increased by 50% or more during the prior 36 months.

Concentration Levels Chart

The guidance is clear that these thresholds do not constitute limits on an institution’s lending activity and are instead intended to function as a high-level indicator of institutions potentially exposed to CRE concentration risk. Conversely, being below these thresholds also does not constitute a “safe harbor” for institutions if other risk indicators are present such as poor underwriting or poor performance metrics such as deteriorating risk rating migration and delinquency.

Case Study: Loan Portfolio Concentration Levels

As noted in the example above, the figures indicate that the bank does not have a high level of construction, and land development loans as the balances do not exceed the 100% threshold level as a percentage of total capital. However, the Bank has exceeded the 300% threshold of non-owner-occupied real estate loans as calculated under the 2006 CRE Guidance.  Additionally, the Bank’s three-year growth rate in this category was 72.7%, which is greater than the 50% reference level that constitutes the second part of the two-part regulatory test for a heightened concentration in this category.

Impact of Loan Acquisitions

It should also be noted that regulatory guidance does not differentiate between organic growth and commercial real estate growth via acquisition. Therefore, all such loans acquired does impact the ratios noted in the concentration chart above.

Loss Estimation in Bank Stress Testing

The basic premise for any stress test modeling is to identify moderate / high loss estimates and the impact to capital on a loan-level basis as well as portfolio-wide. While some community banks provide some stress testing on a transactional basis at origination, the output is typically limited to scenarios that focus primarily on future interest rate fluctuations.

CRE stress test modeling, on the other hand, allows for an organization to gauge potential losses of the CRE portfolio using internal core loan-level data as well as call report data while factoring in other variables that could influence the ultimate collectability of commercial real estate loans.

Loan-Level or Bottom-Up Stress Testing

The bottom-up or loan-level portion of the stress test estimates losses under the stress scenarios on a loan-by-loan basis. The loan selection is typically a function of the desired penetration identified by the organization and is comprised mostly of larger transactions with a sampling of newer originations and adversely risk rated transactions.

In this portion of the analysis, various stress factors are applied to the NOI, collateral value, and interest rate for each loan identified by the Bank. This information, coupled with the transaction’s debt service coverage, liquidation costs and Cap Rates help form a possible loan-level loss for each loan in moderate and in moderate and high-risk scenarios.
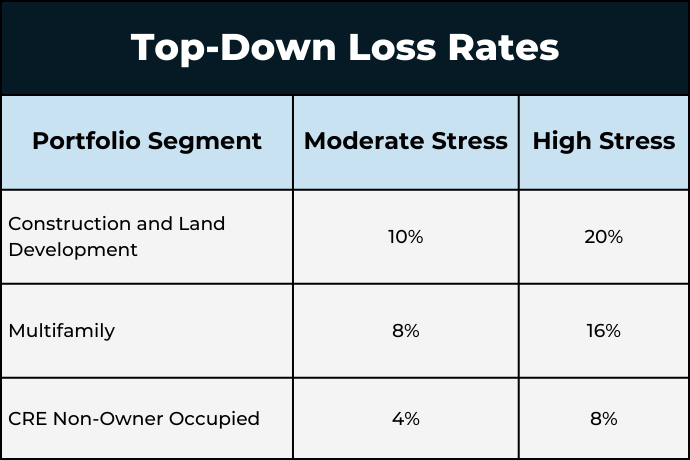
Top-Down Stress Testing

To ensure that the entire CRE portfolio is stressed, a useful model would use a top-down loss estimation method to “fill in” losses on the remaining portfolio for which loan-level information was not provided. This is accomplished by comparing the total balances for which loan-level data was provided in each of the various categories (construction and land development, multifamily, and all other non-owner occupied CRE) to the Bank’s call report. Losses are estimated on the amount of exposure for which loan-level information was not provided by applying a top-down loss rate.

The Moderate and High Stress Scenarios below are determined by applying the loss rates included in the stress test example in the 2012 OCC guidance on community bank stress testing. These loss rates represent two-year loss rates, consistent with the OCC’s stress testing guidance.

Top-Down Loss Rates Chart

Enhancing Portfolio Oversight and Credit Risk Management

Collectively, the “bottom-up (loan level)” and “top-down” moderate and high stress scenarios provide a global overview of a bank’s CRE portfolio and its potential impact to capital. Knowing that this is not a replacement for an enterprise-wide stress test, it allows a bank to provide its management, Board of Directors, and regulators with some context of the estimated losses in this segment of their loan portfolio while also serving as an effective supplement to their internal or third-party loan review.

Historically speaking, any situation in which significant weakness is experienced in critical market and economic factors will result in credit losses that are elevated above those that a bank experiences in “normal” times if unprepared. There is no replacement for appropriate credit administration, however all banks should always utilize tools such as stress testing to enhance their oversight of the metrics behind their CRE portfolio.

The performance of any financial institution and ultimately their ongoing safety and soundness are dependent on the performance of the Bank’s CRE portfolio. It is critical that management and the board of directors ensure that the Bank emphasizes effective implementation of the risk management elements discussed in the 2006 CRE Guidance. These elements include:

  • Continued effective board and management oversight,
  • Effective portfolio management,
  • Ensuring that management information systems are able to provide the information necessary for effective risk management,
  • Performing periodic market analysis and stress testing,
  • Regularly evaluating the appropriateness of credit underwriting standards, and
  • Maintaining an effective credit risk review function

If a financial institution is successful in these endeavors, their CRE loan portfolio should continue to contribute positively to their performance. Accordingly, I am a proponent of all community financial institutions having a stress test performed regularly to ensure the performance of that segment of their loan portfolio as well as the entire organization.

Partner with Young & Associates for Expert CRE Stress Testing

Navigating the complexities of commercial real estate stress testing can be challenging, especially with evolving regulatory expectations and economic uncertainties. At Young & Associates, we offer specialized CRE and Ag portfolio stress testing services designed to address these very challenges. With over 45 years of experience, our team understands the intricacies of regulatory guidance and can provide your community bank with the insights needed to enhance strategic and capital planning.

Our proven stress testing model assesses the potential impacts of adverse economic conditions, helping you manage risk effectively and comply with regulatory expectations. We provide actionable insights to guide your loan product design and underwriting standards, easing the burden of stress testing and supporting your institution’s resilience.

Choose Young & Associates for a partnership that combines deep industry knowledge with a commitment to excellence. Let us help you stay ahead of regulatory demands and strengthen your CRE portfolio management. Reach out to us now to schedule a consultation.


[1]              FDIC, PR 54-2012, Statement to Clarify Supervisory Expectations for Stress Testing by Community Banks. May 14, 2012.

[2]              OCC Bulletin 2012-33, Community Bank Stress Testing: Supervisory Guidance. October 18, 2012.

[3]              FDIC Supervisory Insights, 9(1).” Summer 2012.

[4]              FDIC FIL-104-2006, OCC Bulletin 2006-46, FRB SR 07-1, Concentrations in Commercial Real Estate Lending, Sound Risk Management Practices. December 12, 2006.

[5]              FDIC FIL-62-2015, OCC Bulletin 2015-51, FRB SR 15-17, Statement on Prudent Risk Management for Commercial Real Estate Lending. December 18, 2015.


CDs Maturing in Q2: Impact on Interest Rate Risk Management

By: Michael Gerbick, President at Young & Associates

Interest rate risk (IRR) is the exposure of a bank or credit union’s current or future earnings and capital to adverse changes in market rates. Management of that risk is critical to community financial institutions and since the pandemic and rates went to zero, due to the rapid pace of change, effective management of that risk has been difficult due to the rapid increase in interest rates.

Navigating Market Volatility: The Role of ALM Models 

Most banks and credit unions utilize asset liability management (ALM) models to assist in the modeling of interest rate increases and decreases, typically +/- 400 bp shock scenarios. Similar to the parallel rate shock scenarios of the ALM models designed to identify risk exposure in a rapidly changing rate environment, the Fed raised rates between March 2022 and July 2023 from 0% to 5.25–5.50%.  

The yield curve shape changed significantly, putting additional stress on the Asset Liability Committees (ALCO) responsible for managing the ALM function of financial institutions, and has not let up. Yes, the inverted yield curve has flattened from 12 months ago, however in March this year, the Treasury yield curve for the two-year and ten-year yields hit a consecutive day record for being inverted 625 days, besting the previous record set in 1978.  

The chart shown below1 illustrates the difference between the higher yield 2-year and the lower yield 10-year. 

Strategies Amidst Rising Rates: Insights for Community Banks and Credit Unions 

Amongst many of the strategies employed during the rising rate environment of 2022 and 2023 was offering certificates of deposit (CDs) to maintain and grow deposits on the balance sheet. However, the funding mix began to shift as consumers migrated towards the higher interest-bearing accounts or the Bank increased Federal Home Loan borrowing which caused the cost of funds to increase.  

Industry research for the last two years shows interest-bearing deposits up 5.1% and non-interest-bearing deposits down 28%2. Rates have not risen since July 2023, however many of the CDs offered in 2023 are due to mature in 2024 in a different rate environment than when they were issued. Financial institutions are monitoring this closely.  

Strategic Considerations for ALCOs: Addressing Interest Rate Risk 

ALCOs are tasked with predicting the interest rate exposure in the elevated rate environment. Currently, we are in a unique environment and banks and credit unions should be cautious about using historical data only to predict future activity. In addition to non-bank competitors competing for deposits, community financial institutions need to continue improving their approach to cost of funds, net interest margin compression, and how the institution will effectively manage their exposure to interest rate risk. A few strategies and actions financial institutions can employ related to deposits are: 

Optimizing Interest Rate Exposure

Increase the frequency in which ALCO meets to review the interest rate environment. This may currently be semi-annual or quarterly at your institution. The financial institution may consider meeting monthly to stay abreast of any changes in the environment or new products the Bank is releasing. 

Policy Revision

Review your policy limits approved by the Board. Your policy may only have -100 bp or -200 bp scenarios listed given the previous low-rate environment. Not only review the existing policy limits with the Board but increase the stress range to account for -300 bp and -400 bp. 

Trigger Points

In addition to the policy limits, consider thresholds for the rate of change of the risk measures that consider risks associated with liquidity, interest rate risk, and capital. These rate of change thresholds are designed to commence action or additional investigation into the source of the significant movement ahead of falling outside of policy limits. 

Stress Your Assumptions

ALM models have built-in assumptions and are likely based on historical industry averages supplemented by data supplied by your institution. Common key assumptions outlined by the FDIC3: 

  • Asset Prepayment – represents the change in cash flows from an asset’s contractual repayment schedule. The severity of prepayments fluctuates with various interest rate scenarios. Mortgage loans are a prime example of assets subject to prepayment fluctuations.
  • Non-Maturity Deposits
    • Sensitivity or Beta Factor – describes the magnitude of change in deposit rates compared to a driver rate.
    • Decay Rate – estimates the amount of existing non-maturity deposits that will run off over time.
    • Weighted Average Life – estimates the average effective maturity of the deposits.
  • Driver Rate – represents the rate, or rates, which drive the re-pricing characteristics of assets and liabilities. Examples include Fed funds rate, LIBOR, U.S. Treasury yields, and the WSJ Prime rate.

Have discussions with your team and understand what is going on broadly in the economic environment as well as items specific to your bank or credit union. Address changes or concerns in your modeling assumptions or at the very least, be aware of their potential impact. Spend time to learn the assumptions. Do not accept the defaults as correct, make sure your team understands them.

In addition to your base case, stress the assumptions – double or triple the decay rates, assume a high sensitivity to driver rates in the change in deposit rates, and cut the prepayment speeds in half. The alternate scenarios with severe assumptions will assist ALCO in understanding potential value creation and risks.  

Interest Rate Risk Review

Regulatory guidance indicates that every bank should have an annual third-party assessment of the interest rate risk system. Similar to other audits, this review should be delivered to the Board of Directors or the Board’s audit committee and is a critical component of the Board’s responsibility for bank oversight. 

Educate the Board on Interest Rate Risk

There are educational videos available through the FDIC website. In addition, there are IRR modeling vendors that will attend meetings to provide perspective to your institution on the current economic environment and your modeling results. Leverage them. 

Managing Interest Rate Risk in 2024 and Beyond 

There is always an opportunity for significant value creation in any environment. The rapidly increasing rate environment experienced in 2022-2023 brought forth significant risks and opportunities. The 2024 environment possesses new challenges, and I am excited to see our community banks and credit unions adjust their balance sheets, act on the highest value opportunities, and limit their interest rate exposure.  

Assess Your Interest Rate Risk 

Ready to proactively manage your institution’s interest rate risk? Young & Associates offers comprehensive interest rate risk reviews tailored to your needs. Ensure your bank or credit union is prepared to navigate market volatility with confidence. Reach out to us now to schedule your consultation!


1Federal Reserve Economic Data (FRED) 10-Year Treasury Constant Maturity Minus 2-Year Treasury Constant Maturity
2S&P Global US Bank Market Report 2024
3FDIC Developing Key Assumptions for Analysis of Interest Rate Risk

Connect with a Consultant

Contact us to learn more about our consulting services and how we can add value to your financial institution

Ask a Question