Analyzing the OCC’s Spring 2026 Semiannual Risk Perspective for community bankers

The OCC’s Spring 2026 Semiannual Risk Perspective gives community financial institutions a strategic view of the most significant risks affecting the banking industry. Using the National Risk Committee’s latest findings, the report helps bank leaders evaluate institutional strength, identify emerging threats, and align risk management strategies with evolving federal regulatory expectations. This article examines the key insights and banking industry trends highlighted in the Spring 2026 report.
As the banking industry moves through the spring of 2026, U.S. financial institutions face a market defined by speed, volatility, and structural change. Strong earnings and high liquidity continue to support the system, but rising geopolitical tensions, AI-driven fraud, and mounting commercial real estate refinancing pressure are forcing banks to rethink traditional risk management strategies.

The banking system enters 2026 from a position of strength

The federal banking system enters 2026 from a position of strength, characterized by improved earnings, robust loan growth, and solid balance sheets. In 2025, bank performance was supported by a resilient U.S. economy and a decline in funding costs that drove revenue growth. Capital ratios and liquidity levels remain high by historical standards, with a system-wide liquid assets-to-total assets ratio of 31 percent — more than double the 15 percent recorded in 2008.

The 2026 macroeconomic outlook and structural headwinds

Despite these positive trends, the outlook for 2026 is tempered by significant uncertainties:
  • Geopolitical Risk: The conflict in the Middle East is a primary concern, with the potential to disrupt global energy flows (particularly through the Strait of Hormuz) and fuel inflation.
  • Credit Headwinds: While aggregate credit risk is manageable, specific segments — including commercial real estate (CRE), private credit markets, and consumer credit for lower-score borrowers — require ongoing monitoring.
  • Operational Threats: Cybersecurity remains an elevated risk, driven by sophisticated foreign state-sponsored actors and the emergence of advanced AI tools that enhance the speed and scale of attacks.
  • Regulatory Evolution: The OCC continues to implement the GENIUS Act regarding stablecoins and is working to tailor compliance requirements to reduce the burden on community banks while addressing increased sanctions and money laundering risks.

U.S. economy continues growing despite inflation risks

The U.S. economy grew by 2.1 percent in 2025, outperforming other advanced economies. This growth was driven by strong consumer spending and business investment, particularly in artificial intelligence.

Labor and inflation

  • Labor Market: Unemployment remained low at 4.3 percent as of March 2026. While payroll gains were strong in the first half of 2025, they reversed in the second half, leading to a characterized state of “employer caution” in early 2026. Wage growth eased to 3.4 percent by the end of 2025.
  • Inflation: Core inflation started 2026 at 3.1 percent, remaining above the Federal Reserve’s 2 percent target. Stickiness in service-sector inflation and high shelter costs persist.
  • Monetary Policy: After holding rates steady in early 2025, the Federal Reserve implemented three rate cuts in the second half of that year.

2026–2027 economic projections

According to the April 2026 Blue Chip consensus forecast, real GDP is expected to grow by 2.2 percent in 2026 and 2.0 percent in 2027. However, headline inflation is projected to peak at an annualized 5.1 percent in the second quarter of 2026 due to the Middle East conflict before falling in the second half of the year.

Significant economic risks

  • Strait of Hormuz: Sustained closure could drive higher energy costs, reducing consumer purchasing power and increasing business production expenses.
  • Interest Rate Expectations: Market participants have adjusted expectations downward; the April forecast anticipates only one rate cut in 2026, while financial market pricing suggests even that may not occur.

Bank performance analysis

Profitability for the federal banking system increased in 2025. Return on equity (ROE) exceeded 10 percent for both the total system (12.2 percent) and community banks (11 percent).

Financial trends (2024–2025)

Metric
System Total (2025)
System % Change
Community Banks (2025)
Community % Change
Net Interest Income
$493.9 Billion
+3.7%
$34.4 Billion
+12.2%
Noninterest Income
$249.6 Billion
+11.0%
$11.0 Billion
+7.1%
Net Income
$199.2 Billion
+8.8%
$12.5 Billion
+21.6%
Total Loan Balances
+6.0%
+5.0%
Net interest margins (NIM) improved across the board, particularly for community banks, which benefited from lower funding costs and more favorable asset yields compared to larger institutions. Larger banks saw a quicker downward repricing of their short-term commercial and industrial (C&I) loans.

Key financial risks

Credit risk

Credit quality remains satisfactory, with past-due and nonaccrual loan ratios below long-term averages. However, several sectors show emerging vulnerabilities:
  • CRE: Office properties still face high vacancy rates, though net absorption turned positive in late 2025. Refinancing risk is a major concern as loans originated in low-interest environments mature. Conversely, retail remains a “bright spot” with low vacancy rates.
  • Private Credit: While generally performing well, there are signs of weakening in some sectors. The use of “paid-in-kind” (PIK) mechanisms and debt restructurings may be masking underlying credit deterioration.
  • Consumer Credit: Delinquencies have increased among borrowers with lower credit scores, though supervised banks have manageable exposure to these higher-risk segments.

Market risk

Unrealized losses on securities portfolios fell in 2025 to their lowest levels since 2021. Uninsured deposits saw a modest increase as a share of total deposits, primarily at banks with over $500 billion in assets, though they remain in line with long-term averages.

Compliance and operational risks

Cybersecurity and artificial intelligence

The threat landscape is increasingly dominated by foreign state-sponsored actors and sophisticated criminal groups.
  • AI as a Threat: AI lowers the barrier to entry for cybercriminals, enabling automated reconnaissance, targeted social engineering, and adaptive malware that evades traditional defenses.
  • AI as a Defense: Banks are deploying AI tools to assist with threat monitoring and risk management. The OCC emphasizes that a sound understanding of these tools’ risks and benefits is essential for management.

Fraud risk

Fraud remains a primary driver of operational losses. Impersonation scams facilitated by social media and text messages are rising in sophistication. FinCEN has issued specific alerts regarding health care fraud schemes and money laundering networks.

Compliance and BSA/AML

Geopolitical tensions have strained compliance systems, increasing the risk of Bank Secrecy Act/anti-money laundering (BSA/AML) violations.
  • Supervisory Tailoring: The OCC is working to reduce the regulatory burden on community banks, recently clarifying examination procedures for low-risk institutions and discontinuing the Money Laundering Risk system data collection.
  • Regulatory Changes: A proposed rule is currently under consideration to amend requirements for risk-based AML and countering the financing of terrorism (CFT) programs.

Innovation and digital assets

Artificial intelligence implementation

Banks are adopting generative and agentic AI, primarily for productivity and customer experience tools.
  • Governance: The OCC advocates for “human-in-the-loop” accountability.
  • Challenges: Industry-wide challenges include a lack of explainability, data privacy, “data poisoning,” and validation difficulties.
  • Guidance: OCC Bulletin 2026-13 recently updated model risk management guidance, though generative AI models currently fall outside its specific scope. An interagency Request for Information (RFI) on bank use of AI is expected in the near future.

Digital assets and stablecoins

The regulatory landscape for digital assets is formalizing following the passage of the Guiding and Establishing National Innovation for U.S. Stablecoins (GENIUS) Act on July 18, 2025.
  • Stablecoins: The OCC issued a notice of proposed rulemaking in February 2026 to establish a federal regulatory framework for payment stablecoins.
  • Tokenization: Interagency FAQs released in March 2026 clarified that the technologies used to transact in a security do not generally change its regulatory capital treatment.

OCC’s Spring 2026 Semiannual Risk Perspective and outlook for the banking industry

The banking industry enters 2026 with strong capital levels, high liquidity, and improving profitability. However, regulators increasingly warn that the speed of emerging risks may challenge traditional oversight models. Commercial real estate refinancing pressure, private credit deterioration, AI-driven cyber threats, stablecoin regulation, and geopolitical instability are reshaping the banking landscape.

As financial institutions move deeper into 2026, banks that strengthen risk management, improve operational resilience, and adapt quickly to changing market conditions will likely remain best positioned for long-term stability and growth.

Can a 31% liquidity buffer outrun the 2026 refinancing cliff?

As we move through the spring of 2026, the American banking system resembles a fortress built on a fault line. On the ledger, the industry looks stronger than ever. Bank earnings surged throughout 2025 and pushed the system’s return on equity (ROE) to an impressive 12.2 percent. Community banks, which often absorb economic pressure first, still maintained a solid 11 percent ROE.

However, the most dangerous risks rarely wait for quarterly reporting cycles. Beneath the industry’s profitability, the National Risk Committee’s latest analysis highlights a financial landscape defined by “velocity”: AI-powered fraud evolves rapidly, geopolitical disruptions emerge suddenly, and the commercial real estate “maturity wall” advances steadily. Although the U.S. economy expanded by 2.1 percent in 2025, structural changes now outpace traditional risk management strategies. The latest regulatory data reveals six critical signals shaping the banking industry in 2026.

The 31 percent safety net

The NRC report’s most reassuring finding centers on the industry’s liquidity position. By the end of 2025, liquid assets accounted for 31 percent of total assets across the federal banking system. During the 2008 financial crisis, that same ratio stood at only 15 percent. This doubled buffer is the primary reason the system remains upright despite “higher-for-longer” interest rates and global instability.

Still, analysts cannot rely solely on aggregate figures. The NRC emphasized this point in its executive summary:

“Balance sheets remain strong, with capital ratios and liquidity high by historical standards. Earnings releases for the first quarter of 2026 indicate that these trends have generally persisted.”

The nuance? That 12.2 percent ROE is heavily skewed, driven primarily by the nation’s largest institutions. While the system-wide 31 percent liquidity buffer is a historical anomaly of strength, the underlying reality is a widening gap between the “too big to fail” giants and community banks, which hold a significantly higher concentration of long-term property loans now facing a brutal refinancing environment.

The private credit “performance mirage”

Although aggregate credit risk appears manageable, the NRC raised concerns about the expanding private credit market. As banks increase their exposure to private credit funds, they may unintentionally create what many analysts describe as a “performance mirage.”

The greatest risks sit within loan vintages originated during the low-interest-rate period of 2021 and 2022. Many of these loans still appear healthy on paper, but aggressive restructurings and paid-in-kind (PIK) arrangements often mask underlying weakness. Instead of requiring borrowers to make cash interest payments, lenders allow them to accumulate additional debt.

As a result, funds postpone defaults rather than resolve them. Investors should recognize that today’s stable yields may conceal deteriorating credit quality that could surface abruptly when these loans reach future refinancing deadlines.

The rise of agentic AI

The banking industry has moved past the “Generative AI” hype cycle. The industry now focuses on “Agentic AI,” which refers to autonomous systems capable of participating in material financial decisions such as credit underwriting and automated trading.

While banks maintain a “human-in-the-loop” model for accountability, this technology has intensified the cybersecurity arms race. AI has fundamentally lowered the barrier to entry for cybercriminals, enabling automated reconnaissance and “adaptive malware” that can evolve in real-time to evade traditional defenses.

This shift fundamentally changes the risk landscape. Traditional governance models, which often depend on quarterly reviews and slower oversight processes, struggle to keep pace with rapidly evolving AI-driven threats.

The CRE “maturity wall” and the sun belt chill

Commercial real estate (CRE) remains the banking system’s most visible weakness. The refinancing cliff has moved from theory to reality. Loans issued during the zero-interest-rate era now require refinancing at significantly higher rates, dramatically changing property economics.

  • The Cooling Sun Belt: After a massive supply wave between 2022 and 2024, rental rates in the Sun Belt and Mountain West are facing downward pressure.
  • The Resilient North: Surprisingly, the Northeast and Midwest are outperforming the cooling southern markets in both single-family and multifamily sectors.
  • The Retail Bright Spot: Retail properties have unexpectedly emerged as one of the strongest sectors. Low vacancy rates and limited new development have made retail investments more stable than office properties, which continue to face weak demand and elevated vacancies.

The GENIUS Act’s normalization of digital assets

The regulatory uncertainty surrounding digital assets effectively ended on July 18, 2025, when lawmakers signed the GENIUS (Guiding and Establishing National Innovation for U.S. Stablecoins) Act into law. This legislation formally normalized the digital dollar within the regulated financial system.

The OCC has already begun implementing a federal framework that restricts stablecoin issuance to authorized and regulated entities. Institutional investors received additional clarity on March 5, 2026, when interagency guidance confirmed that tokenization does not alter the regulatory capital treatment of securities.

This signal removes the “novelty” penalty for digital assets, paving the way for stablecoins and tokenized bonds to become standard features of the authorized financial system.

The Strait of Hormuz and the speed of global risk

Despite the domestic strength of the 31 percent liquidity buffer, the banking industry’s 2026 outlook is ultimately hostage to a narrow waterway 7,000 miles away. Analysts at Blue Chip have adopted a more defensive outlook, warning that a prolonged closure of the Strait of Hormuz could materially disrupt the global economy.

A disruption to oil and fertilizer shipments would likely trigger another major inflation spike. Blue Chip’s April forecast projects inflation could reach 5.1 percent during the second quarter under such a scenario. Rising inflation would likely eliminate any possibility of interest rate cuts in 2026 while simultaneously increasing pressure on both global trade and domestic refinancing markets.

As we look toward the second half of the year, the banking industry faces a defining challenge. The central issue no longer concerns the size of financial buffers alone, but the speed of institutional response. Banks must determine whether human-led governance systems can react quickly enough to manage the accelerating risks created by Agentic AI, geopolitical instability, and rapidly shifting financial markets.

The industry’s resilience remains real, but in 2026, the margin for error continues to shrink at an unprecedented pace.

AI technology in the workplace

AI GlassesBy Bill Elliott, CRCM; director of compliance education, Young & Associates

We have recently been made aware of new artificial intelligence (AI) technology that may create additional risk for banks. Apparently, a bank employee had a pair of glasses that doubled as an AI recording device. These glasses were worn to work and were capable of recording private conversations without anyone’s knowledge. It is unclear whether the glasses included video, but that of course is possible. This new technology is being used for a variety of purposes and is continuing to develop.

This is a compliance issue regarding privacy of customer information. If the glasses have a camera and, thus, can “see” and perhaps “record” computer screens of customer information and other bank information, there is potential for substantial increases in your risk under the privacy regulations.

There are also state and federal laws to take into consideration, depending on how the glasses are used. In any case, it is advisable to speak with your bank’s attorney on how to address and handle this new AI technology, as your current human resources (HR) and/or ethics policies likely do not address this issue.

We also recommend that you consider any other changes that may be necessary, as all institutions are going to be facing other manifestations of AI in the not too distant future.

This AI technology may not be in use at your bank yet. However, it is only a matter of time before it will be.

What alternative data can be used to determine creditworthiness?

By Alex Heavner; Credit Analyst, Y&A Credit Services

It is no surprise that building your credit is much more difficult than destroying it. Experts estimate that around 45 million Americans do not even have a credit score.

This group includes approximately 26 million individuals who are credit invisible — those without a credit history at the three major credit bureaus — and 19 million with thin or unscorable credit files.

Traditionally, lenders rely on credit reports, utilization, and the length of credit history to assess creditworthiness.

With the digital boom of the 2010s, fintech companies pioneered the use of alternative data to bring more borrowers into the financial mainstream.

These efforts aim to provide more inclusive, real-time insights into a borrower’s ability and willingness to repay debt.

Creditworthiness Graphic

Types of Alternative Data Being Used

Modern lenders and data aggregators have found several non-traditional data sources that can indicate creditworthiness, including:

  • Rent payments: On-time rent payments are one of the strongest indicators of financial responsibility for consumers without mortgage histories. Services like RentTrack and LevelCredit report rent payments to bureaus.
  • Utility and telecom bills: Payment histories on water, electric, gas, and mobile phone bills can show how consistently a consumer meets financial obligations.
  • Subscription services: Through services like Experian Boost, payments for Netflix, Hulu, or other recurring subscriptions can be used to strengthen a credit file.
  • Bank transaction data: Analyzing income deposits, recurring bills, and cash flow from checking and savings accounts can provide insight into the financial stability of a borrower. This is especially common in open banking models enabled by APIs like Plaid or MX.
  • Employment and education history: Certain alternative scoring models, particularly those used internationally or by startups, incorporate job stability, industry, education level, and professional certifications as proxies for future income and repayment capacity.
  • Social media and behavioral data: Though controversial, some experimental models have assessed consistency in online behavior, device usage, or even language patterns on social platforms to infer risk. These models are rare in the U.S. due to privacy and regulatory concerns.
  • Insurance, rent-to-own, and payday loan history: Nontraditional financial products may also yield data that can supplement thin files—though care must be taken to avoid perpetuating high-risk lending patterns.

Benefits of Using Alternative Data

  • Expanded access to credit for the underbanked and credit invisible.
  • More frequent updates, allowing real-time assessments of financial health.
  • Better risk segmentation, especially in conjunction with traditional models.
  • Potential for compliance with fair lending laws, provided models are explainable and data is obtained with consumer consent.

Risks and Considerations

  • Data privacy and consent: Consumers must opt-in for certain data types, especially bank transactions or subscription history.
  • Model explainability: Lenders must be able to explain adverse actions to borrowers under the Equal Credit Opportunity Act (ECOA).
  • Regulatory scrutiny: The Consumer Financial Protection Bureau (CFPB) and Federal Reserve have emphasized the need for fairness, transparency, and non-discrimination in alternative credit scoring.

Recommendations for Community Banks and Credit Unions

Implementing alternative credit scoring models can be a powerful tool for enhancing financial inclusion and capturing underserved market segments.

Key steps for smaller financial institutions to get started:

1. Start with Rental and Utility Data

Partner with vendors like LevelCredit, RentTrack, or Esusu that provide verifiable and reportable alternative payment data. This low-barrier entry point can help expand lending to young renters and non-homeowners.

2. Use Bank Transaction Data Through Open Banking APIs

Explore partnerships with fintech enablers like Plaid, Finicity, or MX to pull real-time checking and savings account data with customer permission. This can enable cash flow underwriting for small personal loans, credit cards, or small business loans.

3. Integrate Alternative Data into Manual Underwriting

For institutions not ready to adopt full alternative scoring models, underwriters can begin using rent, utility, and bank statement data in exception-based decisions or as compensating factors for borderline credit files.

4. Educate Members and Borrowers

Create marketing and financial education campaigns to inform customers that their rent and utility payments can now help them qualify for loans. Transparency builds trust and increases opt-in rates.

5. Conduct a Pilot Program

Select a product line—such as personal loans under $5,000—and test alternative data scoring on a small scale. Use internal benchmarking to assess default rates, borrower satisfaction, and ROI.

6. Ensure Regulatory Compliance

Collaborate with compliance and legal teams to ensure that all alternative data use complies with the Fair Credit Reporting Act (FCRA), ECOA, and other applicable laws. Use only consumer-permissioned data and ensure you maintain fair lending oversight.

7. Use Hybrid Scoring Models

Adopt tools that integrate both traditional credit data and alternative data into a single risk model. This provides a more holistic picture and improves risk segmentation without abandoning conventional risk management practices.

8. Leverage CUSOs or Vendor Partnerships

If your internal resources are limited, work through a Credit Union Service Organization (CUSO) or regional banking associations to access shared vendor resources or deploy collaborative technology.

Conclusion

The use of alternative data in credit decisioning is not just a fintech trend — it’s a necessary evolution to ensure equitable access to financial services. For community banks and credit unions, embracing these tools can unlock new markets, reduce reliance on traditional credit bureaus, and offer tailored credit options for the next generation of borrowers.

By starting small and building a compliant, transparent framework, these institutions can stay competitive and deepen member relationships. All while continuing to serve their core mission of supporting community growth.

The importance of appraisal reviews in protecting financial institutions

By Casey Simpson; consultant and manager of appraisal review services, Young & Associates

In the real estate industry, accurate and unbiased property appraisals are critical. These influence lending decisions, investment strategies, tax assessments and legal outcomes. Appraisal reviews are a safeguard for financial institutions, investors and the public. Additionally, the regulators outlined this process as a requirement.

Accurate and unbiased property appraisals drive critical decisions in lending, investment strategies, tax assessments and legal outcomes. Appraisal reviews provide safeguards for financial institutions, investors and the public, and regulators mandate the process.

Although appraisal value thresholds have changed over time, the obligation to review appraisals has not. Financial institutions must still conduct a review whenever an appraisal supports a transaction.

The Interagency Appraisal and Evaluation Guidelines from 2010 specifically states, “As part of the credit approval process and prior to a final credit decision, an institution should review appraisals and evaluations to ensure that they comply with the Agencies’ appraisal regulations and are consistent with supervisory guidance and its own internal policies. This review also should ensure that an appraisal or evaluation contains sufficient information and analysis to support the decision to engage in the transaction.”

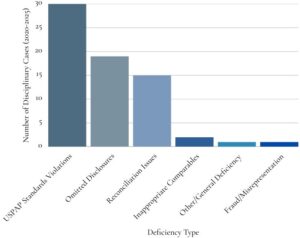
Appraisal Disciplinary Actions chart
Disciplinary cases show that nearly all appraisal deficiencies could have been remediated or prevented through proper reviews. Data: Ohio Appraiser Disciplinary Actions 2020-2025

What are real estate appraisal reviews?

A real estate appraisal review evaluates an appraisal report for completeness, accuracy, consistency and compliance with applicable standards.

Qualified professionals who are independent from the subject transaction and have experience in the relevant property type should perform appraisal reviews to maximize the benefits. Use consistent review checklists with a clear understanding of the client’s scope of work. Align with client-specific requirements and regulatory compliance. Provide a detailed narrative of the transaction appraisal that documents findings and highlights deficiencies or recommendations.

Key benefits of real estate appraisal reviews

  • Enhances accuracy and reliability: Errors, omissions, or flawed assumptions in an appraisal can result in inaccurate valuations. A review identifies discrepancies and unsupported conclusions to ensure the final report is accurate and defensible.
  • Mitigates financial risk: For lenders and investors, misvalued properties carry significant risks. Reviews serve as a risk.
  • Ensures regulatory and standards compliance: Financial institutions are subject to strict regulatory requirements, including the Uniform Standards of Professional Appraisal Practice (USPAP), the Financial Institutions Reform, Recovery, and Enforcement Act of 1989 (FIRREA) and the Dodd-Frank Wall Street Reform and Consumer Protection Act. Appraisal reviews help ensure compliance with these requirements, protecting the institution from legal or regulatory penalties.
  • Improves consistency across valuations: For organizations managing multiple appraisals, reviews promote consistency in methodology, terminology and value conclusions. This supports transparency and establishes quality standards.
  • Cost limitations: Financial institutions with qualified in-house reviewers can use them as a resource to reduce risk. However, third-party providers can provide review services, with costs passed on to the customer as a line item on the closing settlement sheet.

Regulatory compliance explained

Uniform Standards of Professional Appraisal Practice (USPAP)

The purpose of USPAP is to promote and maintain a high level of public trust in appraisal practice by establishing requirements for appraisers. It sets forth standards for all types of appraisal services, including real property, personal property, business, appraisal review and mass appraisal. It is essential that appraisers develop and communicate their analyses, opinions and conclusions to intended users in a manner that is meaningful and not misleading. (source: www.appraisalfoundation.org and www.appraisers.org)

The Dodd-Frank Wall Street Reform and Consumer Protection Act

Commonly known as Dodd-Frank, it is legislation that was passed by the U.S. Congress in response to financial industry behavior that led to the financial crisis of 2007–2008. It sought to make the U.S. financial system safer for consumers and taxpayers. It established a number of new government agencies tasked with overseeing the various components of the law and, by extension, various aspects of the financial system. The Dodd Frank Act aimed to protect the independence of appraisers, reasonable and customary appraisal fees, appraiser certification and education standards, requirements for Appraisal Management Companies (AMC’s), standards for Automated Valuation Models (AVMs) and Broker Price Opinions (BPOs), additional provisions for high-risk mortgages, among other issues. (source: www.investopedia.com by Adam Hayes updated February 01,2025 and Regulatory Issues Facing the Real Estate Appraisal Profession)

Financial Institutions Reform, Recovery, and Enforcement Act of 1989 (FIRREA)

FIRREA has reshaped lending practices, particularly in real estate and mortgage financing. Lenders must adopt rigorous underwriting standards to ensure loans are extended to creditworthy borrowers, reducing the risk of defaults and enhancing financial system stability. Certified appraisals are now required to ensure accurate property valuations, critical for mitigating systemic risk in mortgage-backed securities. (source: www.accountinginsights.org Published Feb 13, 2025 and Regulatory Issues Facing the Real Estate Appraisal Profession)

Financial institutions face heightened risk if appraisals are not thoroughly reviewed. Independent reviews reduce risk, ensure adherence to standards and save valuable staff time. At Young & Associates, we provide independent appraisal reviews that give your team confidence in lending decisions while reducing compliance burdens. Let Young & Associates help you navigate appraisal compliance with confidence and efficiency. Reach out for a consultation.

Federal Crop and Livestock Insurance programs and what’s changing in 2025

By Craig Horsch, Consultant, Young & Associates

Overview of Federal Crop and Livestock Insurance programs

Federal Crop Insurance and Federal Livestock Insurance are supplemental insurances that cover losses which are unavoidable and caused by naturally occurring events. They do not cover losses resulting from negligence or failure to follow good farming practices related to crops and/or livestock.

Federal Crop Insurance Programs include three main programs—Price Loss Coverage (PLC), Agriculture Risk Coverage (ARC), and the Marketing Assistance Loan Program (MALP)—as well as the Whole-Farm Revenue Protection Plan 2025 (WFRP), per the USDA Risk Management Agency.

  • PLC overview:

    PLC program payments are issued when the effective price of a covered commodity is less than the effective reference price for that commodity. The effective price is defined as the higher of the market year average price (MYA) or the national average loan rate for the covered commodity. PLC payments are made to owners of historical base acres and are not tied to the current production of covered commodities. Covered commodities include wheat, corn, sorghum, barley, oats, seed cotton, long- and medium-grain rice, certain pulses, soybeans/other oilseeds, and peanuts.

  • ARC overview:

    There are two types of Agriculture Risk Coverage: Agriculture Risk Coverage–County (ARC-CO) and Agriculture Risk Coverage–Individual (ARC-IC).

    • The ARC-CO program provides income support tied to the same historical base acres—not current production—of covered commodities. ARC-CO payments are issued when the actual county crop revenue of a covered commodity is less than the county ARC-CO guarantee for that commodity.
    • ARC-IC provides income support based on a farm’s revenue from current production of covered commodities, compared with a benchmark average of that farm’s production of those commodities. However, payments are limited to a portion of the farm’s historical base acres. This page focuses on ARC-CO; the ARC-IC program has not been widely adopted.
  • MALP overview:

    The MALP allows producers to use eligible commodities they have produced as collateral for government-issued loans. Eligible commodities include wheat, corn, sorghum, barley, oats, upland and extra-long-staple cotton, long- and medium-grain rice, soybeans and other oilseeds, certain pulses, peanuts, sugar, honey, wool, and mohair.

  • WFRP overview:

    WFRP insurance provides coverage against the loss of revenue that you expect to earn or obtain from commodities you produce or purchase for resale during the insurance period, all under a single insurance policy. WFRP offers benefits such as:

    • A range of coverage levels from 50% to 85% to fit the needs of more farming and ranching operations;
    • Replant coverage for annual crops, except Industrial Hemp;
    • The ability to consider market readiness costs as part of the insured revenue;
    • Provisions to adjust the insurance guarantee to better fit expanding operations;
    • An improved timeline for farming operations that operate as fiscal year filers; and
    • Streamlined underwriting procedures based on the forms used for WFRP.WFRP is designed to meet the needs of highly diverse farms that grow a wide range of commodities and sell to wholesale markets. The WFRP policy was specifically developed for farms that market directly to local or regional buyers, sell through identity-preserved channels, and produce specialty crops, animals, and animal products. The amount of farm revenue you can protect with WFRP insurance is the lower of the revenue expected on your current year’s farm plan or your five-year average historic income, adjusted for growth. This represents an insurable revenue amount that can reasonably be expected to be produced on your farm during the insurance period. All commodities produced by the farm are covered under WFRP, except timber, forest and forest products, and animals used for sport, show, or as pets.It is important to understand that WFRP covers revenue produced during the insurance period. For example, if a calf weighs 800 pounds at the beginning of the insurance period and is sold at 1,200 pounds during the insurance period, the value of production will be the additional 400 pounds gained. Inventory adjustments are used to remove production from previous years and to add revenue for production that has not yet been harvested or sold.

Understanding USDA Livestock Insurance programs

Per the USDA Risk Management Agency website, the Federal Livestock Insurance Programs are as follows:

  • Livestock gross margin – Cattle:

    The LGM for Cattle Insurance Policy provides protection against the loss of gross margin (market value of livestock minus feeder cattle and feed costs) on cattle. The indemnity at the end of the 11-month insurance period is the difference, if positive, between the gross margin guarantee and the actual gross margin. The LGM for Cattle Insurance Policy uses futures prices to determine both the expected and actual gross margins. Adjustments to futures prices are based on state- and month-specific basis levels. The price the producer receives at the local market is not used in these calculations.

    Eligible producers are those who own cattle in the states of Colorado, Illinois, Indiana, Iowa, Kansas, Michigan, Minnesota, Missouri, Montana, Nebraska, Nevada, North Dakota, Ohio, Oklahoma, South Dakota, Texas, Utah, West Virginia, Wisconsin, and Wyoming. Only cattle sold for commercial or private slaughter — primarily intended for human consumption—and fed in one of the eligible states are covered under the LGM for Cattle Insurance Policy.

  • Livestock gross margin – Dairy Cattle:

    The LGM for Dairy Cattle Insurance Policy provides protection against the loss of gross margin (market value of milk minus feed costs) on milk produced from dairy cows. The indemnity at the end of the eleven-month insurance period is the difference, if positive, between the gross margin guarantee and the actual gross margin. The LGM for Dairy Cattle Insurance Policy uses futures prices for corn, soybean meal, and milk to determine the expected and actual gross margins. The price the producer receives at the local market is not used in these calculations.

    Any producer who owns dairy cattle in the contiguous 48 states is eligible for LGM for Dairy Cattle Insurance Policy coverage. Only milk sold for commercial or private sale—primarily intended for final human consumption—from dairy cattle fed in any of the eligible states is covered under this policy.

  • Livestock gross margin – Swine:

    The LGM for Swine Insurance Policy provides protection against the loss of gross margin (market value of livestock minus feed costs) on swine. The indemnity at the end of the 6-month insurance period is the difference, if positive, between the gross margin guarantee and the actual gross margin. The LGM for Swine Insurance Policy uses futures prices to determine both the expected and actual gross margins. The price the producer receives at the local market is not used in these calculations.

    Any producer who owns swine in the 48 contiguous states is eligible for LGM for Swine insurance coverage. Only swine sold for commercial or private slaughter—primarily intended for human consumption—and fed in the 48 contiguous states are eligible for coverage under the LGM for Swine Insurance Policy.


Policy outlook: Projected spending impacts of proposed PLC and ARC-CO changes

In light of potential 2025 farm policy changes, the article “Spending Impacts of PLC and ARC-CO in the House Agriculture Reconciliation Bill” by Schnitkey, Paulson, Coppess (University of Illinois), and Zulauf (Ohio State University), published in farmdoc daily, offers valuable insight into the budgetary and structural implications of proposed revisions to two cornerstone commodity programs: Price Loss Coverage (PLC) and Agricultural Risk Coverage at the County Level (ARC-CO).

Key proposed changes

Under the House Agriculture Reconciliation Bill, four primary changes to PLC and ARC-CO are proposed:

1. Statutory reference price increases:

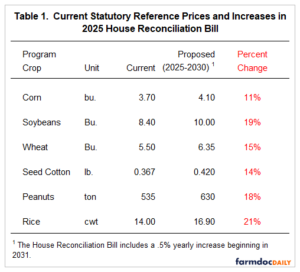
From 2025 to 2030, statutory reference prices for major program crops would increase—for example, from $3.70 to $4.10 per bushel for corn (an 11% increase), from $8.40 to $10.00 for soybeans (19%), and from $5.50 to $6.35 for wheat (15%). Similar increases are also proposed for seed cotton, rice, and peanuts (Schnitkey et al., 2025, Table 1).
2. PLC payment floor adjustments:

The bill proposes new price floors for PLC payments—$3.30 for corn and $0.30 per pound for seed cotton—to limit downside price risk. These new thresholds would reduce outlays in low-price environments by capping PLC payment escalation.

3. ARC-CO enhancements:

Changes to ARC-CO include increasing the coverage level from 86% to 90% and the maximum payment rate from 10% to 12.5% of benchmark revenue, making the program more responsive during periods of reduced revenue.

4. Loan rate increases:

The bill also proposes a 10% increase in the loan rates for the six largest program crops, further enhancing the income safety net (Schnitkey et al., 2025).

Budgetary and distributional impacts

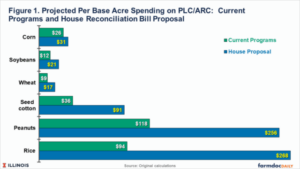
The authors estimate that these program changes would raise federal outlays for PLC, ARC-CO, and marketing loan programs from $46.5 billion to $76.4 billion between 2025 and 2035—a 64% increase (Schnitkey et al., 2025, Table 2). However, this increase is not evenly distributed across commodities or regions:
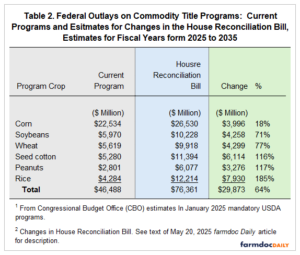
  • Southern crops—notably peanuts, rice, and seed cotton—would see the largest increases in payments per base acre. In contrast, traditional Midwestern crops such as corn and soybeans would receive more modest increases.
  • For farms with 500 base acres, estimated average annual payments under the proposed changes would be:

This disparity stems from differences in statutory reference prices across crops. Southern crops historically have higher relative reference prices, leading to larger government payments — an imbalance that would be widened under the proposed bill (Schnitkey et al., 2025).

Political and policy implications

To fund these increased outlays, the House Agriculture Committee is proposing spending reductions from the Nutrition Title, particularly the Supplemental Nutrition Assistance Program (SNAP). This cost-shifting pits agricultural and nutrition interests against each other and introduces politically sensitive trade-offs that could impact the outcome of future Farm Bill negotiations (Schnitkey et al., 2025).

Why this matters

For agricultural lenders and risk managers, particularly those serving Midwestern crop producers, the proposed updates could affect the farm income landscape, collateral valuations, and overall credit risk. Although support increases are significant for crops like rice and peanuts, the more moderate gains for corn and soybeans mean Midwest producers may see less benefit from the bill in its current form. Understanding the potential outcomes of these policy shifts can help financial institutions refine their risk assessments and prepare clients for what lies ahead.

Staying ahead in a changing agricultural risk landscape

As federal crop and livestock insurance programs evolve — and legislative proposals like those in the 2025 House Agriculture Reconciliation Bill signal substantial shifts in farm subsidy distribution — lenders must be prepared to navigate increased complexity in agricultural credit risk. From changes in PLC and ARC to adjustments in federal loan programs and WFRP, these developments have direct implications for borrower cash flow, collateral valuation, and overall lending strategy.

For financial institutions serving agricultural clients, now is the time to reassess risk management frameworks, update lending practices, and evaluate credit exposures in light of these changes.

Young & Associates has deep expertise in agricultural lending and credit risk analysis. Our team can help your institution proactively adapt, with services that include portfolio review, credit risk management consulting, and tailored support for ag-specific lending challenges. Whether you’re seeking to strengthen underwriting processes or prepare for policy-driven shifts in borrower performance, we’re here to help you respond with confidence.

Explore our lending and credit risk consulting services to learn how we can support your institution’s success in this evolving environment.

References

Coppess, J., C. Zulauf, G. Schnitkey, N. Paulson and B. Sherrick. “Reviewing the House Agriculture Committee’s Reconciliation Bill.” farmdoc daily (15):89, Department of Agricultural and Consumer Economics, University of Illinois at Urbana-Champaign, May 14, 2025. Permalink

Kalaitzandonakes, M., B. Ellison, T. Malone and J. Coppess. “Consumers’ Expectations about GLP-1 Drugs Economic Impact on Food System Players.” farmdoc daily (15):49, Department of Agricultural and Consumer Economics, University of Illinois at Urbana-Champaign, March 14, 2025. Permalink

Schnitkey, G., N. Paulson, C. Zulauf and J. Coppess. “Price Loss Coverage: Evaluation of Proportional Increase in Statutory Reference Price and a Proposal.” farmdoc daily (13):203, Department of Agricultural and Consumer Economics, University of Illinois at Urbana-Champaign, November 7, 2023. Permalink

Schnitkey, G., C. Zulauf, K. Swanson, J. Coppess and N. Paulson. “The Price Loss Coverage (PLC) Option in the 2018 Farm Bill.” farmdoc daily (9):178, Department of Agricultural and Consumer Economics, University of Illinois at Urbana-Champaign, September 24, 2019. Permalink

Schnitkey, G., N. Paulson, C. Zulauf and J. Coppess. “Spending Impacts of PLC and ARC-CO in House Agriculture Reconciliation Bill.” farmdoc daily (15):93, Department of Agricultural and Consumer Economics, University of Illinois at Urbana-Champaign, May 20, 2025. Permalink

The importance of field examinations in asset-based lending

By Ollie Sutherin, chief financial officer, Young & Associates

Asset-based lending is a creative financing alternative that will unlock additional working capital for businesses. While it appears more complex than traditional commercial real estate transactions, the appropriate training and education eliminate intimidation. Many community financial institutions tend to avoid asset-based lending opportunities due to the perceived burden of ongoing monitoring. However, with the appropriate due diligence at the outset of a lending relationship, the process becomes significantly more manageable and efficient.

The reality of ongoing monitoring in asset-based lending

Having worked at a small regional bank, I experienced firsthand the detail-oriented process of handling asset-based lending monitoring. Line of credit renewals often relied heavily on borrowing base certificates (BBCs) — many of which lacked accuracy and detail. Field examinations were seldom part of the equation, and decisions were often based on whether the BBC appeared “sufficient” to support the requested loan amount, whether payments were current, and whether principal was being retired in a frequent manner. What was consistently overlooked were several critical elements:

  • Early detection of fraud or irregularities.
  • Evaluation of internal operational controls.
  • Comprehensive and consistent collateral eligibility testing.
  • Longitudinal trend analysis and risk monitoring.

Field exams: A vital tool for risk mitigation

In today’s competitive lending environment, speed and efficiency are crucial. However, it’s imperative not to sacrifice thorough due diligence for the sake of expediency. Relying solely on BBCs without incorporating periodic field examinations introduces significant risk — risk that could far outweigh the relatively modest cost of performing a field exam. The reality is clear: a field exam provides the lender with a deeper understanding of the borrower’s financial health, operational integrity, and collateral quality. The field exam also provides information that can be used to set appropriate advance rates for the various collateral types.

You don’t know what you don’t know

One illustrative example comes from a colleague who shared her first field examination experience shortly after completing her training and certification. She was tasked with examining receivables for a large borrower. Drawing on the tools and methodology she had just mastered, she uncovered a serious case of fraud whereby the borrower was systematically crediting and rebilling invoices once they aged past 90 days. This practice inflated the eligible receivables reported in the BBC and granted the borrower significantly more borrowing availability than permitted… Without the field exam, this fraud would likely have continued undetected — exposing the financial institution to considerable, non-avoidable risk.

While instances like these may not occur every day, they underscore an essential truth: you don’t know what you don’t know. Field examinations offer lenders a proactive mechanism to confirm the integrity of a borrower’s financial reporting and ensure continued creditworthiness. In asset-based lending, that peace of mind over your relationships far outweighs the small investment.

How Y&A can support your lending program

Asset-based lending can open new avenues for community financial institutions, but it also introduces unique risks that require careful, ongoing oversight — particularly through field exams and detailed collateral monitoring. As illustrated, relying solely on surface-level reporting leaves institutions vulnerable to inaccuracies and potential fraud.

Our Y&A Credit Services team provides a wide range of solutions that support strong credit risk management, including credit underwriting, underwriting reviews and credit administration. These services can help your institution build a solid foundation for managing more complex lending relationships like asset-based lending.

If your team is looking to enhance credit processes, improve documentation quality or strengthen internal controls, Young & Associates is here to help you prepare — strategically and confidently — for what’s ahead. Reach out to us today for a free consultation.

2025 begins with a normal yield curve – but where is the risk?

By Michael Gerbick; president, Young & Associates

On Wednesday, Jan. 29, 2025, Jerome Powell and the Federal Open Market Committee (FOMC) decided to maintain the target range for the federal funds rate at 4.25 – 4.50 percent after three successive cuts totaling 100 bps in September, November and December. Heightened attention and focus continue on the yield curve, as the curve’s shift has been dramatic in recent years.

Yield curve over the years

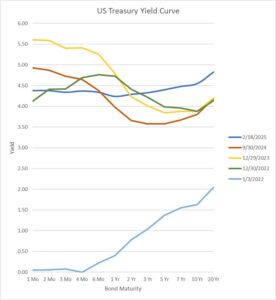
The chart below shows the yield curve at five different points in time from Jan. 2022 to Tuesday, Feb. 18, 2025. The shape of the curve has gone from normal to inverted and now back to normal. Looking at a few different US Treasury Bond maturities over the last 14 months, you can see the one month yield has decreased over 120 bps and the 20 year has increased over 60 bps! Each rate curve shape and elevation imply different opportunities for your balance sheet. A more asset-sensitive and positive gap on a balance sheet may be more attractive for earnings in the short term and helpful when the Fed was raising rates in 2022 and 2023.  A more liability-sensitive and negative gap on a balance sheet may be more attractive for earnings in the short term as the Fed reduces rates. Your ALCO likely understands these shifts well and has managed these drastic movements and their impact on overall strategy.

The normal yield curve indicates improved expectations for economic growth in the years ahead. That said, there is also caution for inflation. When the Fed began rate reductions, there were discussions regarding more cuts totaling 100 bps by year end 2025. Then these ambitious views have shortened to perhaps two cuts of 25 bps each. The yield curve still stands above its level from several years ago, and the Fed Funds rate exceeds the previous cycle’s peak of 2.25–2.50 percent in 2018–2019. The consumer is savvier than they were at that time as well.

At the end of 2024, we spent time interviewing some of our community banker colleagues to gain a pulse on what they are talking internally about in their ALCO meetings concerning interest rate risk. As expected, there is relief to have a normal yield curve instead of managing the inverted one of recent years. Many reasons still create an overall sense of caution heading into 2025, with two key factors briefly discussed in the following sections.

Cost of deposits

Community banks may not realize the full impact of the Fed’s rate reduction in their cost of deposits. Given the continued elevated competition for deposits and the more savvy consumer, community banks may find their deposit rate offering slower to adjust than the Fed’s rate movements and some may see their interest expense actually increase in 2025. There may also be migration to more longer term duration CDs. (movement from less than 6 months to 1 year or more). Yes, longer term CDs will keep the deposit costs higher than non-maturity but will create welcomed funding stability. Continued focus on the bank’s deposit makeup and shifts are necessary. Staggering the CD maturities will be critical for community banks to manage this new environment so as to maintain adequate liquidity levels as CDs mature and consumers make a choice to reinvest, migrate to shorter term or perhaps withdraw their funds.

Investments

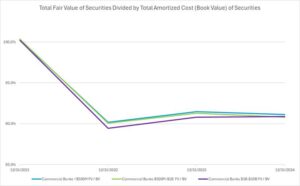
Community banks made many investments with PPP funds and other excess liquidity in a low-rate environment back in 2021. The Fed raised rates 550 bps and many of those investments contributed to a significant amount of unrealized loss. The Fed cut rates 100 bps, and the yield curve no longer shows an inversion. Rates remain elevated, and community banks still hold a significant amount of investments on their balance sheets with unrealized losses. The chart below shows the fair value of investment portfolio expressed as a percent of the amortized cost of the investment portfolio over the last four years for commercial banks.

You can see all three asset sizes over the last four years have a similar trend line. Consider a bank having $100MM in their security portfolio, it is likely its portfolio is currently $7-$10MM underwater. This changes each day as these investments continue to reprice and mature over time.  As they do, bank management is faced with how best to serve its bank. Either by in reinvesting short-term or long-term within their investment portfolio or funding higher yielding loan growth opportunities. Each has liquidity and capital implications that must be considered.

Conclusion

Community banking is resilient. The conversations with community bankers reveal their drive to prepare and plans for managing risk in 2025 and beyond. ALCO and Boards of Directors should continue their sharp focus on managing interest rate risk.  If the deposit competition is fierce for your bank and interest expense in 2025 is expected to be elevated, then focus on what is within your bank’s control. On the asset side of the balance sheet, consider paying attention to the loan and investment portfolios and when they are repricing, what additional loan fee income can be generated, revisiting discussions and confirming the types of loans the bank is comfortable making.

When considering interest rate risk, confirm your bank’s risk profile and remember to stay within the board approved risk parameters. Your bank’s balance sheet may have experienced significant change away from a neutral risk position given the economic environment recently. If you have found your bank is outside the risk parameters, discuss strategies with your board that are designed to get the bank back within acceptable risk thresholds.  Always be clear with the board on expectations and inform them we may not be able to fix this overnight.  One banker said it best when providing advice for community bankers trying manage the interest rate risk of the bank, “Always manage the bank’s IRR to a better position, even if getting to that position takes years… don’t get ahead of your skis and try to do it all in one day.”

Thanks to community bankers that spent time discussing IRR and sharing insights in the interest of helping others.

If you’d like to hear more about our ALM services, reach out as we’d be happy to discuss and assist.

Market shifts and margin pressures

By Michael Gerbick, President, Young & Associates

On Thursday, November 7, 2024, Jerome Powell and the FOMC (Federal Open Market Committee) announced a 25 basis point (bp) interest rate reduction of the federal funds rate just after they announced a 50 bp cut in September.  September’s rate reduction was the first time since March 2020, the Fed has cut rates.  Consider the last several years regarding interest rates: rates dropped to zero in the face of a pandemic, rates skyrocketed 550 bps resulting in an inverted yield curve spanning years, and now another shift in monetary policy.

To provide a visual display of this environment, please view the yield curve over the last few years and then just after the announcement of the latest rate cut on November 7, 2024. Between July 2022 and August 2024, the 10-year bond yield was less than the 2-year yield indicating an inverted yield curve. You can see in the November 8, 2024 curve, the yield on the 2-year bond below the 10-year. The shift in the yield curve has been incredible. Consider the decisions made around each of these points in time at your institution.

US Treasury Yield Curve

This rate environment and the decisions made within it are impacting banks everywhere, especially community financial institutions. Decisions on how best to retain and grow deposits have impacted balance sheets and income statements during this time. It is well-known consumers were placing their money in certificates of deposit (CDs) as rates rose and continued to move their funds to these higher yielding deposit accounts, even after the Fed’s last hike in 2023. The charts below utilize call report information from S&P Global for commercial banks and reveal the deposit mix shift from non-maturity deposits and CDs from the last year. Segmenting CD deposit data from commercial banks by asset size, one can see the shift in the deposit mix for the community banks less than $1B has been the most significant.

CDs as % of Total Deposit Shift September 2023 to September 2024

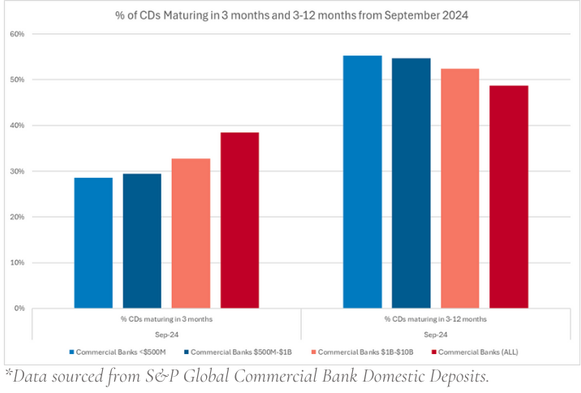
These CDs will mature; the following chart shows the majority of these maturities will take place in the next year (+84 percent), with nearly 30 percent maturing by year end 2024.

% of CDs Maturing in 3 Months and 3-12 Months from September 2024

The deposit shift to CDs is not only more costly to community financial institutions, raising their cost of deposits and ultimately adding pressure to their Net Interest Margin, but they can also be more volatile than traditional non-maturity deposits with savvy depositors more willing to move their deposit relationship to the institution with the highest yielding return. In addition, the data in the charts show this deposit shift is more significant for the smaller community banks with less of an opportunity to reprice in the shorter term than the other community commercial banks.

Many of our community bank colleagues are very much aware of these rising costs and are actively pursuing all resources (including each other) on how best to manage this aspect of the balance sheet. In May 2024, the FDIC released its Annual Risk Review and in June 2024 the OCC released their Semiannual Risk Perspective both outlining significant trends and risks in the banking industry. Among the critical sections in each, the analysis of market risks stands out, particularly for community financial institutions. Both articles have common themes, I’ll break down some important insights from the reports and how they may impact your institution and its strategy in the coming months and years.

Liquidity, deposits and funding: A shifting landscape

Reinforcing the analysis earlier this article, the OCC and FDIC both indicate 2023 saw an increase in the cost of funds for banks as community banks reacted to the rising rate environment and for more savvy consumers. For community banks, which typically have smaller balance sheets and lean heavily on customer relationships, the stability of insured deposits has been a positive. However, the growing trend of depositors seeking higher yields has led to a shift from traditional savings accounts to CDs and other high-yielding options.

This shift puts upward pressure on interest expenses, a trend community financial institutions are already feeling. In fact, CDs accounted for 26 percent of median of all FDIC bank deposits at the end of 2023, compared to 19 percent the previous year. To remain competitive and retain deposits, community banks are raising deposit rates, which in turn increases their cost of funds.

For community banks that have traditionally benefited from lower-cost deposits, this shift represents a double-edged sword — depositors are seeking better returns, but retaining those deposits requires higher costs. The challenge will be finding a balance between offering attractive rates to depositors and managing interest expenses.

Addressing deposit competition

To combat this competition, community financial institutions need to focus on differentiating the value they provide beyond rates. Here are some approaches you may find value in pursuing:

  • Tiered deposit products: Offering tiered-rate accounts for different deposit levels or durations can help incentivize customers to commit their funds for longer periods while minimizing the impact on your cost of funds.
  • Relationship banking: Unlike larger institutions, community banks can leverage personal relationships with customers. Offering value-added services such as financial planning or personalized advisory services can deepen customer loyalty, encouraging them to keep their deposits with your institution even if competitors offer slightly higher rates. This applies to new lending relationships too, prioritize getting the customer’s deposit relationship as the new loan is established.
  • Community initiatives: Reinforce your brand of being an active member of the community. Consider leveraging the relationship banking discussed above; partner with these businesses to sponsor local fundraisers together. Consider avenues to reinforce your commitment to the community with other members of the community. This can not only build loyalty but also emphasize the bank’s role in the community, creating a compelling reason for customers to stay and others to start a relationship with you.

Increased reliance on wholesale funding

Liquidity pressures in 2023 forced banks, especially community institutions, to turn more heavily to wholesale funding to meet liquidity needs. This is especially concerning for community banks that have historically relied on stable local deposits. The FDIC report noted that liquid assets at community banks declined alongside loan growth, driving a reliance on wholesale sources to fund assets. By the end of 2023, 19% of total assets at community banks were funded by wholesale sources, the highest level since 2017.

Wholesale funding often comes with higher costs and introduces funding risk, particularly in periods of market stress. Community banks need to carefully manage this balance, ensuring they have access to cost-effective liquidity while avoiding over-reliance on wholesale sources that could pose risks if market conditions deteriorate.

Net interest margin and interest rate risk

Margin compression and variability among banks

Both the OCC’s and FDIC’s report make it clear that NIM compression is a concern. Although the median NIM increased slightly to 3.45 percent in 2023, this masks the deeper issue: funding costs — particularly deposit rates — are rising faster than loan yields, minimizing the yield gains on the assets. Many community banks saw margin compression as the cost of funds outpaced asset yields.

In the FDIC report it is highlighted that smaller community banks with less than $100 million in assets generally fared better than others, with 70 percent of these institutions reporting higher NIMs comparing 2022 to 2023. This is likely due to their ability to maintain stronger liquidity positions and avoid the sharp increases in funding costs that larger institutions faced. However, even smaller banks are not immune to the challenges posed by rising interest rates, and they may find their NIMs under pressure in the coming quarters as deposit costs continue to rise.

Strategies for managing the squeeze

  • Balancing deposit and loan pricing: The traditional method of managing NIM by lowering deposit rates or raising loan rates may no longer provide the same value it did in the past. Community banks can explore variable-rate loan products with rate floors, which allow for automatic adjustments as interest rates rise and have some protection as rates decline. This provides a hedge against rising funding costs.
  • Dynamic pricing models: Incorporating dynamic pricing strategies for both deposits and loans can help strike the right balance between growth and profitability. For instance, a Midwest community bank adopted a step-up CD product, which started with a competitive rate that increased over time, providing both flexibility for depositors and predictability for the bank’s funding costs.
  • Strategic use of securities portfolios: To manage asset-liability mismatches, community banks can strategically deploy their securities portfolios. If the bank has excess liquidity, consider investing in current higher rate securities. Many banks invested in securities prior to the most recent rising rate environment and have unrealized losses. Although realizing significant loss on the sale of your securities is not ideal, banks should have discussions internally concerning their portfolio, payback period if a loss is realized and the most prudent path forward for their institution.

Interest rate risk environment remains high

For community banks, interest rate risk (IRR) has become an increasingly critical issue. The FDIC’s report points to the elevated share of long-term assets held by these institutions, which could constrain future NIM growth. As interest rates rose rapidly in 2022 and 2023, some community banks began selling off lower-yielding securities to reinvest in higher-rate assets. The OCC reports call out unrealized losses in held-to-maturity portfolios declined in the fourth quarter of 2023, but remained elevated at 11.5 percent. This security management strategy was mentioned earlier in this article and if implemented should be tightly monitored so as to minimize the impact and risk of any realized losses on those securities.

The OCC’s report discusses the uncertainty of the rate environment and depositor behavior prior to the Fed acting and reducing rates. It states:

Uncertainty regarding the rate environment and depositor behavior over the next 12 to 24 months increases the importance of stress testing and sensitivity analysis of deposit assumptions. Given uncharted depositor behavior and rate sensitivity observed during the recent increasing rate environment, prudent risk management would include interest rate risk and liquidity stress-testing scenarios that assume higher than expected deposit competition, resulting in higher-than-expected deposit pricing regardless of rate movement direction.

Well-developed assumptions are key to IRR management and modeling. With a declining rate environment community, banks may want to assume more conservative betas in their repricing assumptions.

Strategic takeaways for community banks

So, what can community financial institutions do based on the data in the OCC and FDIC’s Reviews?

  • Diversify funding sources: The increasing reliance on wholesale funding is costly for community banks. Banks may focus on exploring alternative funding sources or solidifying relationships with local depositors may help mitigate future liquidity pressures.
  • Focus on Asset-Liability Management (ALM): With interest rate risk remaining high, it is critical for community banks to develop more dynamic asset-liability management strategies. Refining the ALM modeling deposit beta assumptions and monitoring the shift of the deposit mix can help to improve forecasts and reduce the risk of negative financial impact. In addition, reinvesting proceeds from lower-yielding securities at higher rates can help but must be carefully managed to avoid significant losses.
  • Manage interest expenses: Even with the Fed reducing rates a total of 75 bps in the last few months, the competition for deposits remains fierce, and many community banks will need to continue offering higher rates to retain customer funds. While this will delay the full impact of cost relief from the Fed’s rate reduction, thoughtful pricing strategies and maintaining a strong loan portfolio could help offset these expenses.

From stress to success: Stay agile, stay informed

As community financial institutions adjust to the Fed’s 50 bps and 25 bps rate reductions and face the challenges outlined in both the FDIC’s 2024 Risk Review and the OCC’s Semiannual Risk Perspective, it is clear that agility and innovation will be key to success. The market risks — ranging from deposit competition and NIM compression to liquidity pressures — are significant, but with strategic thinking and proactive management, community banks can navigate these challenges and continue to thrive. With proactive strategies focused on liquidity management, asset-liability alignment, and cost control, community financial institutions can navigate these turbulent waters and position themselves for success in 2024 and beyond.

For community banks, the key takeaway is clear: stay agile, monitor funding costs closely, and adopt risk mitigation strategies that balance growth with stability. By doing so, these institutions can continue serving their communities and remaining resilient in the face of economic uncertainty.

For over 45 years, Young & Associates has guided community financial institutions through shifting market risks. Whether it’s capital planning, liquidity management risk reviews, or interest rate risk management reviews, our team is here to ensure your institution stays agile and ready to adapt to evolving market conditions. Contact us to learn more about how we can support your success.

CRE stress testing for banks: A crucial tool in a post-COVID world

By Jerry Sutherin, CEO at Young & Associates

Despite having limited requirements as defined by interagency guidance, the case can be made for requiring community financial institutions to have regular stress tests performed on their commercial real estate loan portfolios.

Emerging challenges in commercial real estate lending

Recent post-COVID events have resulted in a heightened concern with regulators as it relates to commercial real estate. Most notably, interest rates have increased 525 bps from March 2022 through July 2023. This correlates with the level of commercial loan delinquencies over that same period as noted in the chart below. This is further exacerbated the “work from home culture” and office vacancies increasing over the same period.

The ultimate impact on the commercial real estate sector is weaker NOIs, coverage ratios that are insufficient to meet loan covenants, higher Cap Rates and lower valuations. For those loans locked into a lower rate, the issue now becomes; what happens when loans mature or reset? That is occurring now.

CRE Composition and Delinquency at US Banks Chart - S&P Global

Regulatory expectations for bank stress testing

Regulatory expectations for community bank stress testing initiatives have been set in both formal regulatory guidance and through more informal publications and statements. An interagency statement was released in May 2012 to provide clarification of supervisory expectations for stress testing by community banks.[1]

The issuance specifically stated that community banks are not required or expected to conduct the types of enterprise stress tests specifically articulated for larger institutions in rules implementing Dodd-Frank stress testing requirements, the agencies’ capital plan for larger institutions, or as described in interagency stress testing guidance for organizations with more than $10 billion in total consolidated assets.

OCC guidance on stress testing practices

However, in October 2012, the OCC provided additional guidance to banks on using stress testing to identify and quantify risk in the loan portfolio and to help establish effective strategic and capital planning processes.[2] The guidance reiterated that complex, enterprise-wide stress testing is not required of community banks. It also states that some stress testing of loan portfolios by community banks is considered to be an important part of sound risk management.

In the guidance, the OCC does not endorse a particular stress testing method for community banks; however, the guidance also discusses common elements that a community bank should consider, including asking plausible “what if” questions about key vulnerabilities; making a reasonable determination of how much impact the stress event or factor might have on earnings and capital; and incorporating the resulting analysis into the bank’s overall risk management process, asset/liability strategies, and strategic and capital planning processes.

The OCC bulletin also provides a simple example of a stress testing framework for community banks. In the summer of 2012, the FDIC also provided further guidance related to community bank stress testing in the Supervisory Insights Summer Edition.[3]

Interagency guidance on commercial real estate risk

Perhaps the most significant piece of guidance related to loan portfolio stress testing for community banks is the 2006 interagency Concentrations in Commercial Real Estate Lending, Sound Risk Management Practices.[4] The continuing importance of and regulatory emphasis on this guidance was made clear in December 2015 when the interagency Statement on Prudent Risk Management for Commercial Real Estate Lending[5] was released, which reiterated the importance of the principles described in the 2006 CRE Guidance.

The 2006 CRE Guidance describes several important practices for effectively managing the risks associated with CRE lending, especially concentration risk. Portfolio stress testing of the CRE portfolio is described as a critical risk management tool for institutions with CRE concentrations.

Examiner expectations for portfolio-level stress testing

While community banks have not been pushed to perform the enterprise-wide stress testing that the above guidance specifically states is not expected of them, examiner expectations for portfolio-level loan stress tests have continued to increase over time and are becoming more prevalent during a bank’s recurring exams. These expectations are centered on portfolios that represent significant concentrations and, given the perceived level of risk and the existence of the 2006 CRE Guidance, are therefore most focused on CRE portfolios.

A reasonable and well-documented approach to CRE portfolio stress testing, undertaken at appropriately frequent intervals such as on an annual basis, is the most effective way for community banks to meet examiner expectations and to contribute toward effective risk management of CRE concentrations.

Regulatory criteria for CRE concentration risk

The guidance also states that strong risk management practices (with stress testing being one of the most important) and appropriate levels of capital are important elements of a sound CRE lending program. Particularly when an institution has a concentration in CRE loans. It then lays out the criteria regulatory agencies utilize as a preliminary means of identifying institutions that are potentially exposed to significant CRE concentration risk:

  1. Total reported loans for construction, land development, and other land represent 100% percent or more of total capital, or
  2. Total commercial real estate loans (as described above) represent 300% or more of the institution’s total capital. The outstanding balance has increased by 50% or more during the prior 36 months.


Concentration Levels Chart

The guidance is clear that these thresholds do not constitute limits on an institution’s lending activity and are instead intended to function as a high-level indicator of institutions potentially exposed to CRE concentration risk. Conversely, being below these thresholds also does not constitute a “safe harbor” for institutions if other risk indicators are present such as poor underwriting or poor performance metrics such as deteriorating risk rating migration and delinquency.

Case study: Loan portfolio concentration levels

As noted in the example above, the figures indicate that the bank does not have a high level of construction, and land development loans as the balances do not exceed the 100% threshold level as a percentage of total capital. However, the Bank has exceeded the 300% threshold of non-owner-occupied real estate loans as calculated under the 2006 CRE Guidance.  Additionally, the Bank’s three-year growth rate in this category was 72.7%, which is greater than the 50% reference level that constitutes the second part of the two-part regulatory test for a heightened concentration in this category.

Impact of loan acquisitions

It should also be noted that regulatory guidance does not differentiate between organic growth and commercial real estate growth via acquisition. Therefore, all such loans acquired does impact the ratios noted in the concentration chart above.

Loss estimation in bank stress testing

The basic premise for any stress test modeling is to identify moderate / high loss estimates. Then look at the impact to capital on a loan-level basis as well as portfolio-wide. While some community banks provide some stress testing on a transactional basis at origination, the output is typically limited to scenarios that focus primarily on future interest rate fluctuations.

CRE stress test modeling, on the other hand, allows for an organization to gauge potential losses of the CRE portfolio using internal core loan-level data as well as call report data while factoring in other variables that could influence the ultimate collectability of commercial real estate loans.

Loan-level or bottom-up stress testing

The bottom-up or loan-level portion of the stress test estimates losses under the stress scenarios on a loan-by-loan basis. The loan selection is typically a function of the desired penetration identified by the organization. It’s comprised mostly of larger transactions with a sampling of newer originations and adversely risk rated transactions.

In this portion of the analysis, various stress factors are applied to the NOI, collateral value, and interest rate for each loan identified by the Bank. This information, coupled with the transaction’s debt service coverage, liquidation costs and Cap Rates help form a possible loan-level loss for each loan in moderate and in moderate and high-risk scenarios.

Top-down stress testing

To ensure that the entire CRE portfolio is stressed, a useful model would use a top-down loss estimation method to “fill in” losses on the remaining portfolio for which loan-level information was not provided. This is accomplished by comparing the total balances for which loan-level data was provided in each of the various categories (construction and land development, multifamily, and all other non-owner occupied CRE) to the Bank’s call report. Losses are estimated on the amount of exposure for which loan-level information was not provided by applying a top-down loss rate.

The Moderate and High Stress Scenarios below are determined by applying the loss rates included in the stress test example in the 2012 OCC guidance on community bank stress testing. These loss rates represent two-year loss rates, consistent with the OCC’s stress testing guidance.

Top-Down Loss Rates Chart

Enhancing portfolio oversight and credit risk management

Collectively, the “bottom-up (loan level)” and “top-down” moderate and high stress scenarios provide a global overview of a bank’s CRE portfolio and its potential impact to capital. Knowing that this is not a replacement for an enterprise-wide stress test. However, it allows a bank to provide its management, board of directors and regulators with some context of the estimated losses in this segment of their loan portfolio. It also serves as an effective supplement to their internal or third-party loan review.

Historically speaking, any situation in which significant weakness is experienced in critical market and economic factors will result in credit losses that are elevated above those that a bank experiences in “normal” times if unprepared. There is no replacement for appropriate credit administration, however all banks should always utilize tools such as stress testing to enhance their oversight of the metrics behind their CRE portfolio.

Financial institution performance and ultimately their ongoing safety and soundness are dependent on the performance of the Bank’s CRE portfolio. It is critical that management and the board of directors ensure that the bank emphasizes effective implementation of the risk management elements discussed in the 2006 CRE Guidance. These elements include:

  • Continued effective board and management oversight,
  • Effective portfolio management,
  • Ensuring that management information systems are able to provide the information necessary for effective risk management,
  • Performing periodic market analysis and stress testing,
  • Regularly evaluating the appropriateness of credit underwriting standards, and
  • Maintaining an effective credit risk review function

If a financial institution is successful in these endeavors, their CRE loan portfolio should continue to contribute positively to their performance. Accordingly, I am a proponent of all community financial institutions having a stress test performed regularly. This helps to ensure the performance of that segment of their loan portfolio as well as the entire organization.

Partner with Young & Associates for expert CRE stress testing

Navigating the complexities of commercial real estate stress testing can be challenging, especially with evolving regulatory expectations and economic uncertainties. At Young & Associates, we offer specialized CRE and Ag portfolio stress testing services designed to address these very challenges. With over 45 years of experience, our team understands the intricacies of regulatory guidance. We can provide your community bank with the insights needed to enhance strategic and capital planning.

Our proven stress testing model assesses the potential impacts of adverse economic conditions. This helps you manage risk effectively and comply with regulatory expectations. We provide actionable insights to guide your loan product design and underwriting standards. This eases the burden of stress testing and supporting your institution’s resilience.

Choose Young & Associates for a partnership that combines deep industry knowledge with a commitment to excellence. Let us help you stay ahead of regulatory demands and strengthen your CRE portfolio management. Reach out to us now to schedule a consultation.


[1]              FDIC, PR 54-2012, Statement to Clarify Supervisory Expectations for Stress Testing by Community Banks. May 14, 2012.

[2]              OCC Bulletin 2012-33, Community Bank Stress Testing: Supervisory Guidance. October 18, 2012.

[3]              FDIC Supervisory Insights, 9(1).” Summer 2012.

[4]              FDIC FIL-104-2006, OCC Bulletin 2006-46, FRB SR 07-1, Concentrations in Commercial Real Estate Lending, Sound Risk Management Practices. December 12, 2006.

[5]              FDIC FIL-62-2015, OCC Bulletin 2015-51, FRB SR 15-17, Statement on Prudent Risk Management for Commercial Real Estate Lending. December 18, 2015.


Internal audit: Your third line of defense in third-party risk management

By Jeanette McKeever, CCBIA, director of internal audit, Young & Associates

In today’s financial landscape, banks and credit unions increasingly rely on third-party vendors to meet regulatory demands, leverage technological advancements and maintain competitive edges. However, these relationships introduce various types of risks in internal audit, from compliance and operational risks to reputational and strategic risks. Amidst economic uncertainty, increased digitalization and growing supervisory attention, many financial institutions are reviewing their third-party risk management (TPRM) frameworks to ensure they are robust and comprehensive.

Here, the role of internal audit becomes indispensable. Internal audit’s role in TPRM goes beyond mere compliance. By leveraging their unique skills and perspectives, internal auditors can help institutions identify, monitor and control risks while achieving strategic goals.

Understanding third-party risk in banking

Third-party relationships and their associated risks require careful management. Ineffective oversight of the complex operational, financial, technological, and legal agreements governing these extended business relationships can lead to brand or reputation damage, data security breaches, and significant financial losses. Additionally, such oversight failures can result in errors in financial reporting, compounding the challenges and potential impacts on the institution.

Financial institutions are entrusting an increasing percentage of their operations to third parties, prompting regulators to scrutinize these relationships more closely. The updated interagency guidance from the Federal Deposit Insurance Corporation (FDIC), the Federal Reserve Board (FRB) and the Office of the Comptroller of the Currency (OCC) outlines the regulatory expectations for managing third-party risks throughout the relationship lifecycle: planning, due diligence, selection, contract negotiation, ongoing monitoring and termination.

Monitoring vendor performance is also a regulatory requirement for credit unions. The National Credit Union Administration (NCUA) specifies the criteria for assessing vendor performance in their 2007 supervisory letter SL No. 07-01, “Evaluating Third-Party Relationships.” This guidance emphasizes key areas for third-party relationship management, including risk assessment and planning, due diligence, risk management, monitoring, and control.

The role of internal audit in third-party risk management

Though Chief Risk Officers are typically responsible for managing third-party risks, internal audit plays a crucial role as the third line of defense. Internal auditors bring essential skills, capabilities, and perspectives to thoroughly examine TPRM programs, identifying gaps or areas for improvement that might have been missed by the second line of defense. The board relies on internal auditors as an extra layer of security to ensure that third-party risks are properly identified and assessed, appropriate internal controls are in place, and timely risk intelligence is generated to inform decision-making.

Leveraging internal audit to improve third-party risk controls

Internal audit can contribute significantly to managing third-party risks through various areas:

  • Pinpointing critical contracts: Internal auditors can assist in identifying high-risk third parties and ensure they receive more frequent scrutiny. This can help with prioritizing risk management efforts.
  • Assessing risk management programs: They can evaluate the effectiveness of third-party due diligence processes and controls, conducting research to gauge the risk level and reputation of third parties.
  • Reviewing compliance with governance standards: Internal auditors can verify if the financial institution’s processes for selecting and managing third parties adhere to governance requirements and include necessary risk and compliance clauses in contracts.
  • Evaluating and improving risk controls: They can assess the effectiveness of risk management controls, ensure regulatory compliance, and check for “right to audit” clauses in third-party agreements.
  • Facilitating informed decision-making: Auditors offer valuable insights into third-party risks. They also evaluate decision-making and contract management processes. This ensures that these processes align with the bank or credit union’s strategic objectives. Additionally, auditors verify that the processes provide sufficient risk protection.
  • Assessing performance and identifying opportunities: They review global third-party performance, detect inconsistencies, and recommend best practices for effective risk and performance management.

Integrating internal audit into third-party risk management strategies

1. Independent vendor risk assessment and identification

Conducting a risk assessment is essential for the initial decision-making process regarding whether to establish a third-party relationship. Internal auditors bring an independent perspective to the assessment and identification of third-party risks. They can perform thorough risk assessments to identify all third-party relationships and associated risks. This independent evaluation helps ensure no significant risk is overlooked, and it provides a holistic view of the financial institution’s third-party risk landscape.

2. Vendor due diligence and selection oversight

The due diligence process equips management with the necessary information to evaluate both the qualitative and quantitative aspects of potential third parties, determining whether a relationship will support the financial institution’s strategic and financial goals while mitigating identified risks.

If your financial institution has its own internal audit team, involving them in the due diligence process for vetting potential third-party relationships can be highly beneficial. Though not prevalent practice in community banks and credit unions yet, leveraging your institution’s third line of defense can enhance third-party risk management processes and provide an extra layer of protection.

Internal audit teams can provide oversight during the due diligence and selection phases of third-party relationships. They can assess the processes used for selecting third parties to confirm that the institution has effective policies and procedures in place. By ensuring thorough due diligence, internal auditors help identify potential risks early on. Their oversight includes evaluating the third party’s operational quality, compliance capabilities, risk profile, and long-term viability.

3. Contract management and compliance

Financial institution management should ensure that the specific expectations and obligations of both the financial institution and the third party are clearly defined in a written contract before finalizing the arrangement. Board or committee approval is required for many material third-party relationships, and significant contracts should be reviewed by appropriate legal counsel before finalization. The level of detail in contract provisions will depend on the scope and risks associated with the third-party relationship. Effective contract management is crucial for mitigating third-party risks. This involves not just due diligence but also thorough processes in agreement formation, publication, activation, compliance with service delivery, analysis, optimization, and offboarding.

The internal audit function can engage in contract management in two key areas:

  1. Auditing the overall contract management process.
  2. Reviewing active contracts with critical vendors.

Auditing the contract management process

An effective contract management process is crucial for maintaining strong performance across your institution. Even minor inefficiencies can lead to significant issues, particularly when your financial institution aims to grow and scale. A robust contract management system contributes to a thriving institution.

Regular audits of your contract management lifecycle can reveal hidden costs and growth opportunities. These audits should assess process deficiencies, compliance issues, and historical management practices. Start by identifying key stages in your process and setting benchmarks for measurement. Key stages often include planning, due diligence, selection, contract negotiation, ongoing monitoring, and termination, as outlined in regulatory guidance.

Evaluate your management practices within each stage. Is the contract management process clearly defined? Are roles and responsibilities assigned? Who ensures compliance with service-level agreements (SLAs)? Addressing these questions through a contract management audit can help identify risks and gaps, ensuring a more effective and efficient process.

Reviewing active contracts with critical vendors

Begin by inventorying and segmenting critical vendors based on risk levels to identify those most critical to audit. Incorporate audits of high-risk and important service provider contracts into your annual audit plan. Gain an understanding of the key risks associated with each service provider and thoroughly review their contracts.

Internal auditors can review critical third-party contracts to ensure they include comprehensive risk and compliance clauses. This includes verifying that contracts have “right to audit” provisions, which allow the institution to monitor third-party compliance continuously. Once you’ve established your audit rights, you can start the contract audit by assessing key legal and business risks. Look for deficiencies and compliance issues in the contract, and consider conducting on-site reviews if your audit rights permit. An efficiency audit may also be warranted to ensure services are delivered as per the contract and service level agreements.

After completing the audit, validate the results, identify root causes, and propose solutions. Finally, communicate the results to the contract owner and key stakeholders, ensuring they are informed of the findings and recommended actions.

4. Ongoing monitoring and reporting

Once a third-party relationship is established, continuous monitoring is essential to manage evolving risks. Internal audit can play a vital role in developing and implementing monitoring frameworks that track third-party performance, compliance and risk exposure. Regular audits and reviews can provide senior management with timely risk intelligence. This enables informed decision-making and ensures that effective internal controls are in place.

5. Internal audit collaboration with risk management functions

Internal audit of third-party risk management becomes more effective when auditors and risk managers collaborate and share information. This allows both to leverage each other’s abilities and tools. By working closely with risk, compliance and other departments, internal auditors can ensure that third-party governance policies and procedures are consistently applied across the bank or credit union.

By integrating third-party risk assessments with audit plans, both auditors and risk management teams can eliminate redundancies in the risk evaluation processes. This approach also helps standardize the risk language used. It offers management teams and boards a comprehensive view of the financial institution’s third-party risk profile. This collaboration integrates TPRM into the overall risk management strategy, enhancing the institution’s ability to manage third-party risks.

Building a robust third-party risk management framework

To effectively manage third-party risks, financial institutions should establish a comprehensive TPRM framework. TPRM necessitates a framework that holds the board of directors and senior management accountable. It requires them to adjust the principles based on the size, scope and criticality of the products or services provided by third parties. This framework should be consistently applied across the institution and integrated into its operational, risk, and compliance management activities. As discussed, key components of a robust TPRM framework include:

  • Defining and Inventorying Third-Party Vendors: Internal audit can assist in identifying and inventorying all third-party relationships, categorizing them by risk level and criticality.
  • Risk Appetite Assessment: Assessing the bank or credit union’s risk appetite concerning third-party relationships, particularly those in high-risk locations or industries.
  • Enhanced Vendor Due Diligence: Conducting enhanced due diligence for critical third-party relationships, ensuring alignment with the institution’s risk profile and regulatory requirements.
  • Ongoing Monitoring and Performance Standards: Establishing and maintaining rigorous monitoring and performance standards for third-party relationships, ensuring continuous compliance and risk management.
  • Training and Awareness: Providing training for stakeholders on TPRM processes and the importance of effective third-party risk management.

Risk-based internal audit for financial institutions

With regulatory bodies calling for enhanced third-party oversight, the imperative for thorough risk and assurance functions has never been greater. These functions must delve deeply into the third-party network. This helps to ensure that critical risks and compliance requirements are diligently managed and monitored. Internal auditors are pivotal in this endeavor and should seek to broaden their role in fortifying third-party risk management.

At Young & Associates, we understand the critical importance of robust TPRM processes. We offer expert consulting services to help banks and credit unions strengthen their internal audit functions, risk management, and more. By leveraging our expertise, financial institutions can enhance their third-party risk management frameworks, ensuring compliance, mitigating risks and achieving strategic objectives. Ultimately, effective TPRM is not just about regulatory compliance; it’s about creating a resilient and thriving financial institution.

For more information on how Young & Associates can support your internal audit needs, click here.

CDs maturing in Q2: Impact on interest rate risk management

By: Michael Gerbick, President at Young & Associates

Interest rate risk (IRR) is the exposure of a bank or credit union’s current or future earnings and capital to adverse changes in market rates. Management of that risk is critical to community financial institutions and since the pandemic and rates went to zero, due to the rapid pace of change, effective management of that risk has been difficult due to the rapid increase in interest rates.

Navigating market volatility: The role of ALM models 

Most banks and credit unions utilize asset liability management (ALM) models to assist in the modeling of interest rate increases and decreases, typically +/- 400 bp shock scenarios. Similar to the parallel rate shock scenarios of the ALM models designed to identify risk exposure in a rapidly changing rate environment, the Fed raised rates between March 2022 and July 2023 from 0 percent to 5.25–5.50 percent.  

The yield curve shape changed significantly, putting additional stress on the Asset Liability Committees (ALCO) responsible for managing the ALM function of financial institutions, and has not let up. Yes, the inverted yield curve has flattened from 12 months ago, however in March this year, the Treasury yield curve for the two-year and ten-year yields hit a consecutive day record for being inverted 625 days, besting the previous record set in 1978.  

The chart shown below1 illustrates the difference between the higher yield 2-year and the lower yield 10-year. 

Strategies amidst rising rates: Insights for community Banks and credit unions 

Amongst many of the strategies employed during the rising rate environment of 2022 and 2023 was offering certificates of deposit (CDs) to maintain and grow deposits on the balance sheet. However, the funding mix began to shift as consumers migrated towards the higher interest-bearing accounts or the Bank increased Federal Home Loan borrowing which caused the cost of funds to increase.  

Industry research for the last two years shows interest-bearing deposits up 5.1 percent and non-interest-bearing deposits down 28 percent2. Rates have not risen since July 2023, however many of the CDs offered in 2023 are due to mature in 2024 in a different rate environment than when they were issued. Financial institutions are monitoring this closely.  

Strategic considerations for ALCOs: Addressing interest rate risk 

ALCOs are tasked with predicting the interest rate exposure in the elevated rate environment. Currently, we are in a unique environment and banks and credit unions should be cautious about using historical data only to predict future activity. In addition to non-bank competitors competing for deposits, community financial institutions need to continue improving their approach to cost of funds, net interest margin compression and how the institution will effectively manage their exposure to interest rate risk. A few strategies and actions financial institutions can employ related to deposits are: 

Optimizing interest rate exposure

Increase the frequency in which ALCO meets to review the interest rate environment. This may currently be semi-annual or quarterly at your institution. Additionally, the financial institution may consider meeting monthly to stay abreast of any changes in the environment or new products the Bank is releasing. 

Policy revision

Review your policy limits approved by the Board. Your policy may only have -100 bp or -200 bp scenarios listed given the previous low-rate environment. Not only review the existing policy limits with the Board but increase the stress range to account for -300 bp and -400 bp. 

Trigger points

In addition to the policy limits, consider thresholds for the rate of change of the risk measures that consider risks associated with liquidity, interest rate risk and capital. Also, these rate of change thresholds are designed to commence action or additional investigation into the source of the significant movement ahead of falling outside of policy limits. 

Stress your assumptions

ALM models have built-in assumptions and are likely based on historical industry averages supplemented by data supplied by your institution. Common key assumptions outlined by the FDIC3: 

  • Asset prepayment – represents the change in cash flows from an asset’s contractual repayment schedule. The severity of prepayments fluctuates with various interest rate scenarios. Mortgage loans are a prime example of assets subject to prepayment fluctuations.
  • Non-maturity deposits
    • Sensitivity or Beta Factor – describes the magnitude of change in deposit rates compared to a driver rate.
    • Decay Rate – estimates the amount of existing non-maturity deposits that will run off over time.
    • Weighted Average Life – estimates the average effective maturity of the deposits.
  • Driver rate – represents the rate, or rates, which drive the re-pricing characteristics of assets and liabilities. Examples include Fed funds rate, LIBOR, U.S. Treasury yields, and the WSJ Prime rate.

Have discussions with your team and understand what is going on broadly in the economic environment as well as items specific to your bank or credit union. Also, address changes or concerns in your modeling assumptions or at the very least, be aware of their potential impact. Spend time to learn the assumptions. Do not accept the defaults as correct, make sure your team understands them.

In addition to your base case, stress the assumptions – double or triple the decay rates, assume a high sensitivity to driver rates in the change in deposit rates and cut the prepayment speeds in half. The alternate scenarios with severe assumptions will assist ALCO in understanding potential value creation and risks.  

Interest rate risk review

Regulatory guidance indicates that every bank should have an annual third-party assessment of the interest rate risk system. Similar to other audits, this review should be delivered to the Board of Directors or the Board’s audit committee. It is a critical component of the Board’s responsibility for bank oversight. 

Educate the board on interest rate risk

There are educational videos available through the FDIC website. In addition, there are IRR modeling vendors that will attend meetings to provide perspective to your institution on the current economic environment and your modeling results. Leverage them. 

Managing interest rate risk in 2024 and beyond 

There is always an opportunity for significant value creation in any environment. The rapidly increasing rate environment experienced in 2022-2023 brought forth significant risks and opportunities. The 2024 environment possesses new challenges. I am excited to see our community banks and credit unions adjust their balance sheets, act on the highest value opportunities and limit their interest rate exposure.  

Assess your interest rate risk 

Ready to proactively manage your institution’s interest rate risk? Young & Associates offers comprehensive interest rate risk reviews tailored to your needs. Ensure your bank or credit union is prepared to navigate market volatility with confidence. Reach out to us now to schedule your consultation!


1Federal Reserve Economic Data (FRED) 10-Year Treasury Constant Maturity Minus 2-Year Treasury Constant Maturity
2S&P Global US Bank Market Report 2024
3FDIC Developing Key Assumptions for Analysis of Interest Rate Risk

Connect with a Consultant

Contact us to learn more about our consulting services and how we can add value to your financial institution

Ask a Question