
Tag: underwriting

Intel’s Ohio investment creates opportunity for economic growth and lending

Digital render of Intel's new facility
Digital render of Intel’s new facility located in Central Ohio. Photo courtesy of Intel

By Alex Heavner; Credit Analyst, Young & Associates

Intel is transforming nearly 1,000 acres in New Albany, Ohio, with a $28 billion investment in two advanced chip factories. The site will produce some of the industry’s most advanced semiconductor processors. Ground broke on the project in 2022, with completion anticipated by 2027.

The benefits of a tech giant like Intel establishing a presence in Central Ohio are vast. The direct economic impact begins with the creation of more than 7,000 construction jobs. Once operational, Intel expects to employ at least 3,000 individuals on-site or remotely. Beyond these, more than 10,000 directly impacted workers in the surrounding communities will experience significant growth in the years to come.

Intel intends to onboard more than 350 Ohio-based companies into its supply chain. Small businesses, franchises and startups are expected to flock to the area to capitalize on the expanding ecosystem. Intel’s investment may create tens of thousands of new jobs in industries beyond its own.

Intel has also committed $100 million to support educational initiatives in Ohio, aimed at developing a skilled talent pipeline and strengthening local research institutions. As of May 2025, $17.7 million of that commitment has been allocated. This funding has awarded more than 2,300 scholarships and helped educate over 9,000 students through partnerships with more than 80 colleges and universities. In addition, Intel is rolling out Khanmigo, an AI-powered tutor and teaching assistant, to select middle and high schools.

How Intel helps construct opportunity

According to comprehensive economic models, Intel’s presence is expected to increase Ohio’s GDP by $2.3 billion annually. A significant portion of this growth will stem from the rise in local business development — creating a surge in demand for commercial construction and property development financing.

New Albany is uniquely positioned for this expansion. It is the only Columbus suburb where commercial land use outpaces residential, with 43 percent allocated to business and 31 percent to housing. The city actively seeks to reduce the residential tax burden by increasing commercial revenue, which currently comprises more than 80 percent of the city’s general fund — largely derived from income taxes collected in the business park. This commercial focus directly contributes to enhanced infrastructure, services and quality of life for residents.

Lending: The backbone of community growth

None of this economic potential is realized without one critical component: access to capital. Lending is the engine that turns opportunity into action.

Contractors, electricians, HVAC technicians and landscapers will need financing to purchase or lease vehicles and equipment essential for their trades. Many will also rely on financing for payroll and up-front material costs during lengthy projects.

Restaurants, retailers and healthcare providers require funding to secure land, finance construction, purchase equipment and obtain the necessary licenses to open and operate. In short, every facet of the economy will be touched by lending.

Construction lending, however, carries unique risks. Delays caused by weather, labor shortages or supply chain disruptions are common. Rain could halt progress for a week and time lost is money lost. These interruptions can jeopardize loan repayment and force lenders to make difficult decisions — continue funding, renegotiate terms or sell the loan to mitigate losses.

Additionally, fluctuating material costs and unforeseen expenses can lead to budget overruns. Mismanagement could prevent borrowers from repaying loans, increasing the risk of default. While the unfinished structure typically serves as collateral, its incomplete status may significantly reduce its resale value, leaving lenders exposed.

To manage these risks, financial institutions employ construction inspectors who monitor progress and confirm that funds are being used appropriately. Construction loans are structured with draw schedules — funds are released only after specific milestones are verified. Borrowers often self-fund the initial project phase or may apply for a mobilization draw, a smaller, closely monitored loan intended to cover startup expenses.

Fueling small business growth

Not all small businesses will qualify for traditional loans. That’s where Small Business Administration (SBA) programs come into play.

SBA 7(a) loans provide up to 85 percent loan guarantees, significantly reducing the lender’s risk and encouraging lending to small and growing businesses. These guarantees are not a safety net for default. Borrowers are still held accountable and collateral is pursued before the SBA covers any shortfall.

SBA 504 loans offer another avenue, providing long-term, fixed-rate financing for purchasing real estate, buildings and large equipment. These options are crucial for entrepreneurs looking to seize the opportunities Intel’s investment is creating.

Intel’s investment prepares Central Ohio for progress

Financial institutions are proactively expanding their operations in Central Ohio to meet the demands of this unprecedented economic growth. Many are opening regional hubs, hiring local talent and leveraging advanced technologies to streamline services and improve responsiveness.

For instance, Wells Fargo has established a new technology center in the Easton area of Columbus, expected to generate up to 500 jobs with average annual salaries of $125,000. Regional and community banks are also taking strategic steps, such as partnering with colleges and universities to strengthen talent pipelines and improve workforce readiness.

Institutions are embracing fintech and artificial intelligence (AI) to enhance efficiency, accuracy and scalability. AI tools now support underwriting decisions, smart contract development through blockchain improvements and embedded finance integration — all essential for staying competitive in a fast-evolving market.

Intel creates strategic positioning for financial institutions

To fully capitalize on the economic momentum generated by Intel’s investment, financial institutions must act strategically, proactively positioning themselves to serve both the direct and peripheral financial needs arising in the region. This includes preparing for a substantial increase in commercial lending activity, establishing competitive advantages and reinforcing operational infrastructure.

  1. Expand commercial lending capabilities: Assess commercial lending teams and workflows. Strengthen underwriting capacity and approval efficiency to handle increased loan volume.
  2. Build industry expertise: Develop knowledge of construction, SBA and commercial real estate lending. Partner with experts like Young & Associates for guidance and training.
  3. Strengthen risk management and compliance: Update credit policies, perform stress testing and enhance compliance programs. Ensure regulatory readiness in areas like CRA, fair lending and BSA/AML.
  4. Invest in scalable technology: Modernize systems to improve loan origination, analytics and customer experience. Utilize AI and data tools to increase capacity without sacrificing quality.
  5. Forge local and regional partnerships: Build relationships with developers, contractors and municipalities for early insight and lending opportunities.
  6. Prepare for talent demands: Plan for increased hiring needs. Launch internship programs and partnerships with universities to attract future talent.

Opportunity meets expertise

At Young & Associates and Y&A Credit Services, we support financial institutions navigating increased demands brought on by the Intel development and broader regional growth. Our decades of experience allow us to provide highly specialized consulting in areas such as underwriting, risk management, regulatory compliance and operational scalability.

Our consultants are well-versed in both national regulations and Ohio’s unique financial environment. We remain committed to helping community financial institutions capitalize on opportunity while remaining compliant, competitive and resilient.

Breaking down agricultural production revenue cycles for ag lending

By Craig Horsch, Consultant, Young & Associates

With Ag borrowers facing tight margins in 2025, financial institutions must carefully examine agricultural production revenue cycles to measure each borrower’s actual crop and livestock production against annual projections.

Additionally, measuring and testing each different revenue stream the farmer produces crops (corn, soybeans, wheat, oats, milo, hay, etc.) or livestock (beef cattle, dairy cattle, hogs, chickens, turkeys, sheep, goats or other livestock)

Financial institutions have historically analyzed the grain crops (corn, soybeans, wheat, oats, milo, hay, etc.) revenue production cycle very well; however, livestock revenue streams are not as frequently monitored to evaluate the borrower’s efficiencies within their respective revenue production cycles.

Analyzing the agricultural production revenue cycles

Measuring the revenue production cycles also provides the bank with an opportunity to identify the following:

  • Assess the borrower’s management skills.
  • The accuracy of the borrower’s projections.
  • The efficiencies within the production cycle.
  • The weakness within the production cycle.
  • Financial trends (negative or positive) within the production cycle.
  • Compare actual performance with projected revenue and expenses.
  • Where did the production cycle provide a benefit to the operations?
  • Where did the production cycle provide a detriment to the operations?
  • Were there any surprises (positives or negatives) during the production cycle?
  • Were projections within 10 percent of the actual performance?
  • Were there any critical or unusual events that occurred during the production cycle that negatively impacted revenue?

When underwriting an Ag borrower, consider analyzing and discussing each of the borrower’s revenue streams that contribute toward the repayment of the loan, such as the number of livestock or acres they farm overall, acres owned and leased, the projections for the upcoming year and the percentage each revenue stream contributes to the overall revenue stream. If livestock, discuss the type of livestock (dairy, beef, hogs, chickens, turkey, sheep, goats, etc.), the number of head, if a cow/calf (beef or dairy cattle) or dairy operation, a farrowing only, a finishing only or a farrow to finishing (hogs), a poultry or other livestock operation.

The USDA-ERS projects 2025 net farm income at $179.8 billion, up $52 billion from last year on record livestock prices and government payments.Not all sectors share in the gain. Crop receipts are forecast to fall 2.5 percent, led by declines in corn, soybeans and wheat, while fruits, nuts and cattle continue to rise. These swings, shown in the chart, reflect a long history of volatility. For lenders, the bottom line is clear: repayment risk depends on where borrowers are in the cycle, not just on headline numbers.
The USDA-ERS projects 2025 net farm income at $179.8 billion, up $52 billion from last year on record livestock prices and government payments. Not all sectors share in the gain. Crop receipts are forecast to fall 2.5 percent, led by declines in corn, soybeans and wheat, while fruits, nuts and cattle continue to rise. These swings, shown in the chart, reflect a long history of volatility. For lenders, the bottom line is clear: repayment risk depends on where borrowers are in the cycle, not just on headline numbers.

Discuss production projections for the upcoming year or the number of turns per year (hogs & poultry), etc. By completing this analysis, the bank may be able to identify which revenue stream is the strongest and weakest and which is the largest and smallest contributor to the overall revenue stream.

Identify the sources of revenue, such as grain, dairy, beef, hogs, poultry, sheep, goats or other livestock. Indicate each source’s share of total production in dollar amounts or percentages and explain how often the cycle for each source is completed. It is important to confirm that the producer is accurately capturing pertinent data for each revenue stream.

Projections vs. reality in agricultural production revenue cycles

Compare the production cycle actual performance with the borrower’s projections for the ag related cycle being measured.

  • Are they very accurate based upon the conditions of the respective cycle?
  • Is their revenue production within 10 percent of their budgeted projections?
    1. This is a way to assess the borrower’s budgeting capabilities
    2. Farm management skills
    3. Knowledge of costs
    4. Are they realistic pricing costs & selling commodity prices?
  • Do they know their costs?
  • Provide a look-back period: Are their projections reasonable compared to their actual costs?

Stress Test the borrower’s projections by 10 percent on price and 10 percent on yield to determine where the projected cash flow would be if a major adverse event occurred during the crop or livestock cycle, such as drought, bird flu, hoof & mouth, mastitis, etc.

By analyzing each revenue cycle, banks can identify strengths and weaknesses in a borrower’s management, budgeting, marketing and knowledge of costs and markets, thus improving the credit risk analysis of current or requested facilities.

Federal Crop and Livestock Insurance programs and what’s changing in 2025

By Craig Horsch, Consultant, Young & Associates

Overview of Federal Crop and Livestock Insurance programs

Federal Crop Insurance and Federal Livestock Insurance are supplemental insurances that cover losses which are unavoidable and caused by naturally occurring events. They do not cover losses resulting from negligence or failure to follow good farming practices related to crops and/or livestock.

Federal Crop Insurance Programs include three main programs—Price Loss Coverage (PLC), Agriculture Risk Coverage (ARC), and the Marketing Assistance Loan Program (MALP)—as well as the Whole-Farm Revenue Protection Plan 2025 (WFRP), per the USDA Risk Management Agency.

  • PLC overview:

    PLC program payments are issued when the effective price of a covered commodity is less than the effective reference price for that commodity. The effective price is defined as the higher of the market year average price (MYA) or the national average loan rate for the covered commodity. PLC payments are made to owners of historical base acres and are not tied to the current production of covered commodities. Covered commodities include wheat, corn, sorghum, barley, oats, seed cotton, long- and medium-grain rice, certain pulses, soybeans/other oilseeds, and peanuts.

  • ARC overview:

    There are two types of Agriculture Risk Coverage: Agriculture Risk Coverage–County (ARC-CO) and Agriculture Risk Coverage–Individual (ARC-IC).

    • The ARC-CO program provides income support tied to the same historical base acres—not current production—of covered commodities. ARC-CO payments are issued when the actual county crop revenue of a covered commodity is less than the county ARC-CO guarantee for that commodity.
    • ARC-IC provides income support based on a farm’s revenue from current production of covered commodities, compared with a benchmark average of that farm’s production of those commodities. However, payments are limited to a portion of the farm’s historical base acres. This page focuses on ARC-CO; the ARC-IC program has not been widely adopted.
  • MALP overview:

    The MALP allows producers to use eligible commodities they have produced as collateral for government-issued loans. Eligible commodities include wheat, corn, sorghum, barley, oats, upland and extra-long-staple cotton, long- and medium-grain rice, soybeans and other oilseeds, certain pulses, peanuts, sugar, honey, wool, and mohair.

  • WFRP overview:

    WFRP insurance provides coverage against the loss of revenue that you expect to earn or obtain from commodities you produce or purchase for resale during the insurance period, all under a single insurance policy. WFRP offers benefits such as:

    • A range of coverage levels from 50% to 85% to fit the needs of more farming and ranching operations;
    • Replant coverage for annual crops, except Industrial Hemp;
    • The ability to consider market readiness costs as part of the insured revenue;
    • Provisions to adjust the insurance guarantee to better fit expanding operations;
    • An improved timeline for farming operations that operate as fiscal year filers; and
    • Streamlined underwriting procedures based on the forms used for WFRP.WFRP is designed to meet the needs of highly diverse farms that grow a wide range of commodities and sell to wholesale markets. The WFRP policy was specifically developed for farms that market directly to local or regional buyers, sell through identity-preserved channels, and produce specialty crops, animals, and animal products. The amount of farm revenue you can protect with WFRP insurance is the lower of the revenue expected on your current year’s farm plan or your five-year average historic income, adjusted for growth. This represents an insurable revenue amount that can reasonably be expected to be produced on your farm during the insurance period. All commodities produced by the farm are covered under WFRP, except timber, forest and forest products, and animals used for sport, show, or as pets.It is important to understand that WFRP covers revenue produced during the insurance period. For example, if a calf weighs 800 pounds at the beginning of the insurance period and is sold at 1,200 pounds during the insurance period, the value of production will be the additional 400 pounds gained. Inventory adjustments are used to remove production from previous years and to add revenue for production that has not yet been harvested or sold.

Understanding USDA Livestock Insurance programs

Per the USDA Risk Management Agency website, the Federal Livestock Insurance Programs are as follows:

  • Livestock gross margin – Cattle:

    The LGM for Cattle Insurance Policy provides protection against the loss of gross margin (market value of livestock minus feeder cattle and feed costs) on cattle. The indemnity at the end of the 11-month insurance period is the difference, if positive, between the gross margin guarantee and the actual gross margin. The LGM for Cattle Insurance Policy uses futures prices to determine both the expected and actual gross margins. Adjustments to futures prices are based on state- and month-specific basis levels. The price the producer receives at the local market is not used in these calculations.

    Eligible producers are those who own cattle in the states of Colorado, Illinois, Indiana, Iowa, Kansas, Michigan, Minnesota, Missouri, Montana, Nebraska, Nevada, North Dakota, Ohio, Oklahoma, South Dakota, Texas, Utah, West Virginia, Wisconsin, and Wyoming. Only cattle sold for commercial or private slaughter — primarily intended for human consumption—and fed in one of the eligible states are covered under the LGM for Cattle Insurance Policy.

  • Livestock gross margin – Dairy Cattle:

    The LGM for Dairy Cattle Insurance Policy provides protection against the loss of gross margin (market value of milk minus feed costs) on milk produced from dairy cows. The indemnity at the end of the eleven-month insurance period is the difference, if positive, between the gross margin guarantee and the actual gross margin. The LGM for Dairy Cattle Insurance Policy uses futures prices for corn, soybean meal, and milk to determine the expected and actual gross margins. The price the producer receives at the local market is not used in these calculations.

    Any producer who owns dairy cattle in the contiguous 48 states is eligible for LGM for Dairy Cattle Insurance Policy coverage. Only milk sold for commercial or private sale—primarily intended for final human consumption—from dairy cattle fed in any of the eligible states is covered under this policy.

  • Livestock gross margin – Swine:

    The LGM for Swine Insurance Policy provides protection against the loss of gross margin (market value of livestock minus feed costs) on swine. The indemnity at the end of the 6-month insurance period is the difference, if positive, between the gross margin guarantee and the actual gross margin. The LGM for Swine Insurance Policy uses futures prices to determine both the expected and actual gross margins. The price the producer receives at the local market is not used in these calculations.

    Any producer who owns swine in the 48 contiguous states is eligible for LGM for Swine insurance coverage. Only swine sold for commercial or private slaughter—primarily intended for human consumption—and fed in the 48 contiguous states are eligible for coverage under the LGM for Swine Insurance Policy.


Policy outlook: Projected spending impacts of proposed PLC and ARC-CO changes

In light of potential 2025 farm policy changes, the article “Spending Impacts of PLC and ARC-CO in the House Agriculture Reconciliation Bill” by Schnitkey, Paulson, Coppess (University of Illinois), and Zulauf (Ohio State University), published in farmdoc daily, offers valuable insight into the budgetary and structural implications of proposed revisions to two cornerstone commodity programs: Price Loss Coverage (PLC) and Agricultural Risk Coverage at the County Level (ARC-CO).

Key proposed changes

Under the House Agriculture Reconciliation Bill, four primary changes to PLC and ARC-CO are proposed:

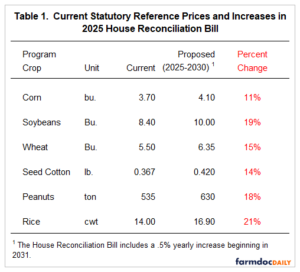
1. Statutory reference price increases:

From 2025 to 2030, statutory reference prices for major program crops would increase—for example, from $3.70 to $4.10 per bushel for corn (an 11% increase), from $8.40 to $10.00 for soybeans (19%), and from $5.50 to $6.35 for wheat (15%). Similar increases are also proposed for seed cotton, rice, and peanuts (Schnitkey et al., 2025, Table 1).

2. PLC payment floor adjustments:

The bill proposes new price floors for PLC payments—$3.30 for corn and $0.30 per pound for seed cotton—to limit downside price risk. These new thresholds would reduce outlays in low-price environments by capping PLC payment escalation.

3. ARC-CO enhancements:

Changes to ARC-CO include increasing the coverage level from 86% to 90% and the maximum payment rate from 10% to 12.5% of benchmark revenue, making the program more responsive during periods of reduced revenue.

4. Loan rate increases:

The bill also proposes a 10% increase in the loan rates for the six largest program crops, further enhancing the income safety net (Schnitkey et al., 2025).

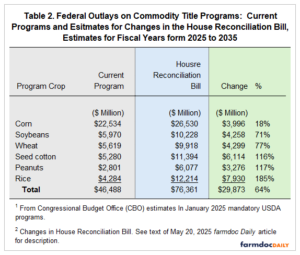
Budgetary and distributional impacts

The authors estimate that these program changes would raise federal outlays for PLC, ARC-CO, and marketing loan programs from $46.5 billion to $76.4 billion between 2025 and 2035—a 64% increase (Schnitkey et al., 2025, Table 2). However, this increase is not evenly distributed across commodities or regions:

  • Southern crops—notably peanuts, rice, and seed cotton—would see the largest increases in payments per base acre. In contrast, traditional Midwestern crops such as corn and soybeans would receive more modest increases.
  • For farms with 500 base acres, estimated average annual payments under the proposed changes would be:

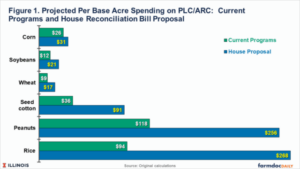
This disparity stems from differences in statutory reference prices across crops. Southern crops historically have higher relative reference prices, leading to larger government payments — an imbalance that would be widened under the proposed bill (Schnitkey et al., 2025).

Political and policy implications

To fund these increased outlays, the House Agriculture Committee is proposing spending reductions from the Nutrition Title, particularly the Supplemental Nutrition Assistance Program (SNAP). This cost-shifting pits agricultural and nutrition interests against each other and introduces politically sensitive trade-offs that could impact the outcome of future Farm Bill negotiations (Schnitkey et al., 2025).

Why this matters

For agricultural lenders and risk managers, particularly those serving Midwestern crop producers, the proposed updates could affect the farm income landscape, collateral valuations, and overall credit risk. Although support increases are significant for crops like rice and peanuts, the more moderate gains for corn and soybeans mean Midwest producers may see less benefit from the bill in its current form. Understanding the potential outcomes of these policy shifts can help financial institutions refine their risk assessments and prepare clients for what lies ahead.

Staying ahead in a changing agricultural risk landscape

As federal crop and livestock insurance programs evolve — and legislative proposals like those in the 2025 House Agriculture Reconciliation Bill signal substantial shifts in farm subsidy distribution — lenders must be prepared to navigate increased complexity in agricultural credit risk. From changes in PLC and ARC to adjustments in federal loan programs and WFRP, these developments have direct implications for borrower cash flow, collateral valuation, and overall lending strategy.

For financial institutions serving agricultural clients, now is the time to reassess risk management frameworks, update lending practices, and evaluate credit exposures in light of these changes.

Young & Associates has deep expertise in agricultural lending and credit risk analysis. Our team can help your institution proactively adapt, with services that include portfolio review, credit risk management consulting, and tailored support for ag-specific lending challenges. Whether you’re seeking to strengthen underwriting processes or prepare for policy-driven shifts in borrower performance, we’re here to help you respond with confidence.

Explore our lending and credit risk consulting services to learn how we can support your institution’s success in this evolving environment.

References

Coppess, J., C. Zulauf, G. Schnitkey, N. Paulson and B. Sherrick. “Reviewing the House Agriculture Committee’s Reconciliation Bill.” farmdoc daily (15):89, Department of Agricultural and Consumer Economics, University of Illinois at Urbana-Champaign, May 14, 2025. Permalink

Kalaitzandonakes, M., B. Ellison, T. Malone and J. Coppess. “Consumers’ Expectations about GLP-1 Drugs Economic Impact on Food System Players.” farmdoc daily (15):49, Department of Agricultural and Consumer Economics, University of Illinois at Urbana-Champaign, March 14, 2025. Permalink

Schnitkey, G., N. Paulson, C. Zulauf and J. Coppess. “Price Loss Coverage: Evaluation of Proportional Increase in Statutory Reference Price and a Proposal.” farmdoc daily (13):203, Department of Agricultural and Consumer Economics, University of Illinois at Urbana-Champaign, November 7, 2023. Permalink

Schnitkey, G., C. Zulauf, K. Swanson, J. Coppess and N. Paulson. “The Price Loss Coverage (PLC) Option in the 2018 Farm Bill.” farmdoc daily (9):178, Department of Agricultural and Consumer Economics, University of Illinois at Urbana-Champaign, September 24, 2019. Permalink

Schnitkey, G., N. Paulson, C. Zulauf and J. Coppess. “Spending Impacts of PLC and ARC-CO in House Agriculture Reconciliation Bill.” farmdoc daily (15):93, Department of Agricultural and Consumer Economics, University of Illinois at Urbana-Champaign, May 20, 2025. Permalink

The importance of field examinations in asset-based lending

By Ollie Sutherin, chief financial officer, Young & Associates

Asset-based lending is a creative financing alternative that will unlock additional working capital for businesses. While it appears more complex than traditional commercial real estate transactions, the appropriate training and education eliminate intimidation. Many community financial institutions tend to avoid asset-based lending opportunities due to the perceived burden of ongoing monitoring. However, with the appropriate due diligence at the outset of a lending relationship, the process becomes significantly more manageable and efficient.

The reality of ongoing monitoring in asset-based lending

Having worked at a small regional bank, I experienced firsthand the detail-oriented process of handling asset-based lending monitoring. Line of credit renewals often relied heavily on borrowing base certificates (BBCs) — many of which lacked accuracy and detail. Field examinations were seldom part of the equation, and decisions were often based on whether the BBC appeared “sufficient” to support the requested loan amount, whether payments were current, and whether principal was being retired in a frequent manner. What was consistently overlooked were several critical elements:

  • Early detection of fraud or irregularities.
  • Evaluation of internal operational controls.
  • Comprehensive and consistent collateral eligibility testing.
  • Longitudinal trend analysis and risk monitoring.

Field exams: A vital tool for risk mitigation

In today’s competitive lending environment, speed and efficiency are crucial. However, it’s imperative not to sacrifice thorough due diligence for the sake of expediency. Relying solely on BBCs without incorporating periodic field examinations introduces significant risk — risk that could far outweigh the relatively modest cost of performing a field exam. The reality is clear: a field exam provides the lender with a deeper understanding of the borrower’s financial health, operational integrity, and collateral quality. The field exam also provides information that can be used to set appropriate advance rates for the various collateral types.

You don’t know what you don’t know

One illustrative example comes from a colleague who shared her first field examination experience shortly after completing her training and certification. She was tasked with examining receivables for a large borrower. Drawing on the tools and methodology she had just mastered, she uncovered a serious case of fraud whereby the borrower was systematically crediting and rebilling invoices once they aged past 90 days. This practice inflated the eligible receivables reported in the BBC and granted the borrower significantly more borrowing availability than permitted… Without the field exam, this fraud would likely have continued undetected — exposing the financial institution to considerable, non-avoidable risk.

While instances like these may not occur every day, they underscore an essential truth: you don’t know what you don’t know. Field examinations offer lenders a proactive mechanism to confirm the integrity of a borrower’s financial reporting and ensure continued creditworthiness. In asset-based lending, that peace of mind over your relationships far outweighs the small investment.

How Y&A can support your lending program

Asset-based lending can open new avenues for community financial institutions, but it also introduces unique risks that require careful, ongoing oversight — particularly through field exams and detailed collateral monitoring. As illustrated, relying solely on surface-level reporting leaves institutions vulnerable to inaccuracies and potential fraud.

Our Y&A Credit Services team provides a wide range of solutions that support strong credit risk management, including credit underwriting, underwriting reviews and credit administration. These services can help your institution build a solid foundation for managing more complex lending relationships like asset-based lending.

If your team is looking to enhance credit processes, improve documentation quality or strengthen internal controls, Young & Associates is here to help you prepare — strategically and confidently — for what’s ahead. Reach out to us today for a free consultation.

CRE stress testing for banks: A crucial tool in a post-COVID world

By Jerry Sutherin, CEO at Young & Associates

Despite having limited requirements as defined by interagency guidance, the case can be made for requiring community financial institutions to have regular stress tests performed on their commercial real estate loan portfolios.

Emerging challenges in commercial real estate lending

Recent post-COVID events have resulted in a heightened concern with regulators as it relates to commercial real estate. Most notably, interest rates have increased 525 bps from March 2022 through July 2023. This correlates with the level of commercial loan delinquencies over that same period as noted in the chart below. This is further exacerbated the “work from home culture” and office vacancies increasing over the same period.

The ultimate impact on the commercial real estate sector is weaker NOIs, coverage ratios that are insufficient to meet loan covenants, higher Cap Rates and lower valuations. For those loans locked into a lower rate, the issue now becomes; what happens when loans mature or reset? That is occurring now.

CRE Composition and Delinquency at US Banks Chart - S&P Global

Regulatory expectations for bank stress testing

Regulatory expectations for community bank stress testing initiatives have been set in both formal regulatory guidance and through more informal publications and statements. An interagency statement was released in May 2012 to provide clarification of supervisory expectations for stress testing by community banks.[1]

The issuance specifically stated that community banks are not required or expected to conduct the types of enterprise stress tests specifically articulated for larger institutions in rules implementing Dodd-Frank stress testing requirements, the agencies’ capital plan for larger institutions, or as described in interagency stress testing guidance for organizations with more than $10 billion in total consolidated assets.

OCC guidance on stress testing practices

However, in October 2012, the OCC provided additional guidance to banks on using stress testing to identify and quantify risk in the loan portfolio and to help establish effective strategic and capital planning processes.[2] The guidance reiterated that complex, enterprise-wide stress testing is not required of community banks. It also states that some stress testing of loan portfolios by community banks is considered to be an important part of sound risk management.

In the guidance, the OCC does not endorse a particular stress testing method for community banks; however, the guidance also discusses common elements that a community bank should consider, including asking plausible “what if” questions about key vulnerabilities; making a reasonable determination of how much impact the stress event or factor might have on earnings and capital; and incorporating the resulting analysis into the bank’s overall risk management process, asset/liability strategies, and strategic and capital planning processes.

The OCC bulletin also provides a simple example of a stress testing framework for community banks. In the summer of 2012, the FDIC also provided further guidance related to community bank stress testing in the Supervisory Insights Summer Edition.[3]

Interagency guidance on commercial real estate risk

Perhaps the most significant piece of guidance related to loan portfolio stress testing for community banks is the 2006 interagency Concentrations in Commercial Real Estate Lending, Sound Risk Management Practices.[4] The continuing importance of and regulatory emphasis on this guidance was made clear in December 2015 when the interagency Statement on Prudent Risk Management for Commercial Real Estate Lending[5] was released, which reiterated the importance of the principles described in the 2006 CRE Guidance.

The 2006 CRE Guidance describes several important practices for effectively managing the risks associated with CRE lending, especially concentration risk. Portfolio stress testing of the CRE portfolio is described as a critical risk management tool for institutions with CRE concentrations.

Examiner expectations for portfolio-level stress testing

While community banks have not been pushed to perform the enterprise-wide stress testing that the above guidance specifically states is not expected of them, examiner expectations for portfolio-level loan stress tests have continued to increase over time and are becoming more prevalent during a bank’s recurring exams. These expectations are centered on portfolios that represent significant concentrations and, given the perceived level of risk and the existence of the 2006 CRE Guidance, are therefore most focused on CRE portfolios.

A reasonable and well-documented approach to CRE portfolio stress testing, undertaken at appropriately frequent intervals such as on an annual basis, is the most effective way for community banks to meet examiner expectations and to contribute toward effective risk management of CRE concentrations.

Regulatory criteria for CRE concentration risk

The guidance also states that strong risk management practices (with stress testing being one of the most important) and appropriate levels of capital are important elements of a sound CRE lending program. Particularly when an institution has a concentration in CRE loans. It then lays out the criteria regulatory agencies utilize as a preliminary means of identifying institutions that are potentially exposed to significant CRE concentration risk:

  1. Total reported loans for construction, land development, and other land represent 100% percent or more of total capital, or
  2. Total commercial real estate loans (as described above) represent 300% or more of the institution’s total capital. The outstanding balance has increased by 50% or more during the prior 36 months.

Concentration Levels Chart

The guidance is clear that these thresholds do not constitute limits on an institution’s lending activity and are instead intended to function as a high-level indicator of institutions potentially exposed to CRE concentration risk. Conversely, being below these thresholds also does not constitute a “safe harbor” for institutions if other risk indicators are present such as poor underwriting or poor performance metrics such as deteriorating risk rating migration and delinquency.

Case study: Loan portfolio concentration levels

As noted in the example above, the figures indicate that the bank does not have a high level of construction, and land development loans as the balances do not exceed the 100% threshold level as a percentage of total capital. However, the Bank has exceeded the 300% threshold of non-owner-occupied real estate loans as calculated under the 2006 CRE Guidance.  Additionally, the Bank’s three-year growth rate in this category was 72.7%, which is greater than the 50% reference level that constitutes the second part of the two-part regulatory test for a heightened concentration in this category.

Impact of loan acquisitions

It should also be noted that regulatory guidance does not differentiate between organic growth and commercial real estate growth via acquisition. Therefore, all such loans acquired does impact the ratios noted in the concentration chart above.

Loss estimation in bank stress testing

The basic premise for any stress test modeling is to identify moderate / high loss estimates. Then look at the impact to capital on a loan-level basis as well as portfolio-wide. While some community banks provide some stress testing on a transactional basis at origination, the output is typically limited to scenarios that focus primarily on future interest rate fluctuations.

CRE stress test modeling, on the other hand, allows for an organization to gauge potential losses of the CRE portfolio using internal core loan-level data as well as call report data while factoring in other variables that could influence the ultimate collectability of commercial real estate loans.

Loan-level or bottom-up stress testing

The bottom-up or loan-level portion of the stress test estimates losses under the stress scenarios on a loan-by-loan basis. The loan selection is typically a function of the desired penetration identified by the organization. It’s comprised mostly of larger transactions with a sampling of newer originations and adversely risk rated transactions.

In this portion of the analysis, various stress factors are applied to the NOI, collateral value, and interest rate for each loan identified by the Bank. This information, coupled with the transaction’s debt service coverage, liquidation costs and Cap Rates help form a possible loan-level loss for each loan in moderate and in moderate and high-risk scenarios.

Top-down stress testing

To ensure that the entire CRE portfolio is stressed, a useful model would use a top-down loss estimation method to “fill in” losses on the remaining portfolio for which loan-level information was not provided. This is accomplished by comparing the total balances for which loan-level data was provided in each of the various categories (construction and land development, multifamily, and all other non-owner occupied CRE) to the Bank’s call report. Losses are estimated on the amount of exposure for which loan-level information was not provided by applying a top-down loss rate.

The Moderate and High Stress Scenarios below are determined by applying the loss rates included in the stress test example in the 2012 OCC guidance on community bank stress testing. These loss rates represent two-year loss rates, consistent with the OCC’s stress testing guidance.

Top-Down Loss Rates Chart

Enhancing portfolio oversight and credit risk management

Collectively, the “bottom-up (loan level)” and “top-down” moderate and high stress scenarios provide a global overview of a bank’s CRE portfolio and its potential impact to capital. Knowing that this is not a replacement for an enterprise-wide stress test. However, it allows a bank to provide its management, board of directors and regulators with some context of the estimated losses in this segment of their loan portfolio. It also serves as an effective supplement to their internal or third-party loan review.

Historically speaking, any situation in which significant weakness is experienced in critical market and economic factors will result in credit losses that are elevated above those that a bank experiences in “normal” times if unprepared. There is no replacement for appropriate credit administration, however all banks should always utilize tools such as stress testing to enhance their oversight of the metrics behind their CRE portfolio.

Financial institution performance and ultimately their ongoing safety and soundness are dependent on the performance of the Bank’s CRE portfolio. It is critical that management and the board of directors ensure that the bank emphasizes effective implementation of the risk management elements discussed in the 2006 CRE Guidance. These elements include:

  • Continued effective board and management oversight,
  • Effective portfolio management,
  • Ensuring that management information systems are able to provide the information necessary for effective risk management,
  • Performing periodic market analysis and stress testing,
  • Regularly evaluating the appropriateness of credit underwriting standards, and
  • Maintaining an effective credit risk review function

If a financial institution is successful in these endeavors, their CRE loan portfolio should continue to contribute positively to their performance. Accordingly, I am a proponent of all community financial institutions having a stress test performed regularly. This helps to ensure the performance of that segment of their loan portfolio as well as the entire organization.

Partner with Young & Associates for expert CRE stress testing

Navigating the complexities of commercial real estate stress testing can be challenging, especially with evolving regulatory expectations and economic uncertainties. At Young & Associates, we offer specialized CRE and Ag portfolio stress testing services designed to address these very challenges. With over 45 years of experience, our team understands the intricacies of regulatory guidance. We can provide your community bank with the insights needed to enhance strategic and capital planning.

Our proven stress testing model assesses the potential impacts of adverse economic conditions. This helps you manage risk effectively and comply with regulatory expectations. We provide actionable insights to guide your loan product design and underwriting standards. This eases the burden of stress testing and supporting your institution’s resilience.

Choose Young & Associates for a partnership that combines deep industry knowledge with a commitment to excellence. Let us help you stay ahead of regulatory demands and strengthen your CRE portfolio management. Reach out to us now to schedule a consultation.


[1]              FDIC, PR 54-2012, Statement to Clarify Supervisory Expectations for Stress Testing by Community Banks. May 14, 2012.

[2]              OCC Bulletin 2012-33, Community Bank Stress Testing: Supervisory Guidance. October 18, 2012.

[3]              FDIC Supervisory Insights, 9(1).” Summer 2012.

[4]              FDIC FIL-104-2006, OCC Bulletin 2006-46, FRB SR 07-1, Concentrations in Commercial Real Estate Lending, Sound Risk Management Practices. December 12, 2006.

[5]              FDIC FIL-62-2015, OCC Bulletin 2015-51, FRB SR 15-17, Statement on Prudent Risk Management for Commercial Real Estate Lending. December 18, 2015.


The art of safe lending: How to mitigate commercial loan underwriting risks

By: Ollie Sutherin, Principal of Y&A Credit Services

Community financial institutions have long been known for their agility and personalized service, excelling at creating unique lending solutions and facilitating distinct transactions. However, the very attributes that have set them apart may now present fresh challenges as they seek to expand. Community banks and credit unions find themselves navigating a delicate equilibrium: effectively managing underwriting risk, diversifying their loan portfolios, and growing to better serve their communities. 

Additionally, the world of commercial loan underwriting presents its own distinctive challenges that further complicate finding this equilibrium. Commercial loan underwriting standards, in particular, are designed to foster relationship banking rather than transactional interactions. Loans are underwritten based on the borrower’s anticipated ability to operate their business profitably and service the debt being requested. However, the actual cash flows of borrowers can often deviate from expectations, and the value of collateral securing these loans may fluctuate. Most commercial loans are secured by the assets they finance, along with other business assets such as accounts receivable or inventory, and sometimes entail personal guarantees. Loans secured by accounts receivable heavily rely on the borrower’s ability to collect due amounts from customers. These complexities create a web of considerations for underwriters. 

Effective management of a community financial institution’s loan portfolio necessitates a strategic approach guided by skilled underwriters who play a pivotal role in mitigating underwriting risks in commercial lending. 

The aftereffects of the SVB collapse 

A little over six months have passed since the financial world experienced a seismic shift when a prominent regional bank collapsed. This event sent shockwaves throughout the banking sector, triggering a chain reaction that affected numerous other financial institutions, both regional and local. These far-reaching consequences have also left their mark on various aspects of community bank and credit union operations. 

Risk management has always held a pivotal role in credit underwriting, and its significance has become more pronounced in today’s ever-volatile environment. As we navigate an era of monetary tightening, global inflationary pressures, and increasing interest rates, underwriters find themselves under increased scrutiny. In the past, cheap funding was abundant, but now, risk-appropriate pricing is paramount for funding new deals. Underwriters must balance a new interest rate environment with the heightened lending and refinancing risks, necessitating increased diligence in risk assessments when extending credit and negotiating terms. 

To shed light on this matter, we will explore effective strategies for community financial institutions to limit underwriting risk in commercial lending, ensuring they can thrive while maintaining a prudent approach to lending.  

Comprehensive credit analysis 

The cornerstone of any sound underwriting process is conducting a comprehensive credit analysis. This involves digging deep into the current financial health of the borrower, their business, and the industry they operate in. By meticulously assessing factors like cash flow, collateral, and credit history, you can gain a clearer picture of the borrower’s ability to repay the loan. 

Moreover, consider working with an experienced outsourced credit underwriting service like Y&A Credit Services to ensure you have access to the latest data, analytical tools, and expertise in evaluating commercial loans. Our team of experts can assist from reviewing your analysis to completely underwriting the transaction, ensuring you have all the information to help you make informed lending decisions. 

Diversification of loan portfolios 

Diversification is a risk management principle that rings true in commercial lending as well. By diversifying your loan portfolios across various industries and business types, you can reduce your exposure to sector-specific risks. A balanced mix of loans in manufacturing, real estate, healthcare, and other sectors can help buffer your institution against economic downturns that may affect a particular industry. 

Loan covenants and monitoring 

Establishing clear and enforceable loan covenants is another key step in limiting underwriting risk. These covenants set out the terms and conditions under which the borrower must operate and repay the loan. Regularly monitoring the borrower’s compliance with these covenants and requesting the most current information from your borrower is equally important. It allows you to detect early warning signs of financial distress and take corrective action sooner when you have more options for a successful outcome for both your borrower and your institution. 

Loan portfolio stress testing 

Stress testing is an invaluable tool for gauging how your loan portfolio would perform under adverse conditions. By modeling various scenarios against your portfolio, you can assess your institution’s vulnerability to economic shocks and make proactive adjustments to your lending practices. 

Ongoing training and education 

Staying up to date with the latest industry trends, regulations, and best practices is essential. Encourage your staff to engage in ongoing training and education programs related to commercial lending and underwriting. This ensures that your institution’s underwriting processes remain current and effective. 

Regular commercial loan underwriting reviews 

To maintain the health of your loan portfolio, it’s crucial to conduct regular reviews of your commercial loan underwriting practices. This ensures that your institution’s standards and processes align with the evolving landscape of commercial lending. It also allows you to make necessary adjustments and refinements to minimize underwriting risks continuously. 

Outsourcing commercial credit underwriting 

Third party assistance for commercial credit underwriting can help to ensure the accuracy and effectiveness of your underwriting processes. It can relieve your institution of the need to maintain an up-to-date full-time staff.  Professional outsourced services, like Y&A Credit Services, offer expertise, access to advanced analytical tools, and an impartial perspective. We help your institution make sound lending decisions and maintain high underwriting standards.  These services can be implemented from fully outsourced to fractional, helping assist during peaks in volume.  

Y&A Credit Services’ guidance in commercial underwriting 

Mitigating underwriting risk in commercial lending is pivotal for upholding financial health and stability of community banks and credit unions. Especially in the wake of the industry upheaval earlier this year. By implementing comprehensive credit analysis, diversifying loan portfolios, enforcing loan covenants, conducting stress tests, and investing in ongoing training, regular reviews, and outsourcing, you can confidently navigate the complexities of commercial lending while minimizing risks and enhance your institution’s lending capabilities. 

At Y&A Credit Services, we understand the importance of risk management in commercial lending. We’re here to guide you through the process. Our outsourced credit underwriting services are designed to offer the expertise and resources needed to make sound lending decisions. Together, we can build a more secure lending future for your institution, helping our communities one loan at a time. 

Contact us today to learn how we can help. 

Loan underwriting issues in a shrinking market

By Ollie Sutherin, chief financial officer, Young & Associates

It is no secret that community banking is shrinking at an increasing rate across the entire United States. At the close of Q4 2022, there were approximately 4,548 community banks across all 50 states. This is a net decrease of about 200 active charters since the FDIC completed its Community Banking Study in 2020. Of these 4,548 active charters, nearly 50 percent of the community banks are in counties with a population of 50,000 individuals or less, and all these institutions combined make up about 97 percent of the banking industry as a whole.

Challenges for community-focused lenders

Despite their market share, the fact that nearly 50 percent of the community banks serve counties with less than 50,000 people presents risks and difficulties for them to continue their missions as community-centered institutions.

One of the primary difficulties is the ability to hire and retain quality talent needed to maintain good practices and good standing with regulatory bodies. This is especially evident in the banks that serve 50,000 people or less, as populations in rural areas continue to decrease.

Furthermore, the increasing burden of inflation and wages adds another layer of complexity to the mix. Many community-focused institutions are not willing or able to pay top rate for talent, which is understandable given the need and focus to remain competitive among the larger regional and national banks that continue to acquire and/or out-compete them.

Outsource excellence for your credit underwriting

One of Young & Associates, Inc.’s primary missions is to serve community financial institutions across the country. Recognizing the risks and difficulties stated above, we have formed an independent affiliate, Y&A Credit Services, LLC.

As an independent entity, Y&A Credit Services offers the same exceptional service, expertise, and integrity you’ve learned to expect from Young & Associates, Inc. Our team members are experts in credit services and the financial industry and include former chief credit officers and senior credit analysts from both community and regional banks and provide full outsourced credit department services to our clients, keeping their costs low so they can remain competitive in their markets. This creates less risk with respect to the regulatory bodies as our seasoned credit professionals boast a combined 100+ years of experience in credit administration.

Finding talent is one issue, but affording it is another issue. By outsourcing credit responsibilities such as underwriting, annual reviews, and spreading financials, Y&A Credit Services can complete the work of several full-time employees at rates far less than the bank’s full-time employee.

In summary, you can trust Y&A Credit Services to handle all your credit needs, ranging from simple commercial real estate transactions to the most complex C&I deals. Furthermore, Y&A Credit Services can complete this work in your preferred format using our advanced credit software. We recognize the risk of deviating from years of good practice and strive to ensure that we are meeting your standards. We also recognize that we are here to assist you in every way possible and will provide you with recommendations and good practices gleaned from extensive experience dealing with credit departments across the entire country and the regulatory bodies overseeing them.

For more information on Y&A Credit Services and how we can assist you with your credit underwriting needs, contact me at osutherin@younginc.com or 330. 422.3453. I look forward to discussing how we can assist your organization with your credit underwriting needs.

Key elements of effective credit underwriting

By Ollie Sutherin, chief financial officer, Young & Associates

The focus of this article is to provide an overview of what Y&A Credit Services views as key elements during the underwriting process. While there are many variables needed to effectively underwrite credits, below are the primary focal points of any quality credit presentation that we underwrite or review.

Cash is king

“Cash is king” is a saying that we use often as it translates to, “if you don’t have the cash to repay, you shouldn’t have the loan.” So often we are presented with transactions that aren’t the strongest, don’t show cash flow, and the underlying organization has no business being lent money. Lenders often try to form complex explanations regarding the guarantor’s wherewithal, global cash flow, etc., and they lose sight of the actual company, its financial condition, and its ability to service the debt on a stand-alone basis.

Every analysis should begin with the subject company and its ability to service debt. If it is a real estate holding company and the note is secured by a specific property, what is the cash flow of that property? If the most recent tax return statement, compiled, audited, etc., does not evidence the ability to service debt, what is the trend of the company? What are they doing to improve from the previous year and what is the YTD revenue/expenses compared to the prior year?

Eventually, we take into consideration the guarantor’s wherewithal and how it impacts the cash flow; however, the primary focus should always be on the company itself (the primary repayment source). If a transaction is being presented where repayment is heavily reliant on the guarantor, then the following questions must be asked: What is their character like? Have all of the assets and liabilities been verified on their personal financial statement(s)? Are other contingent liabilities factored in as well? So often, mistakes are caught when analysts simply say, “John Doe has $1,000,000 in cash and is clearly able to service the subject note should it be needed” without doing the proper due diligence verifying the source of the cash.

Quality of information

If the cash flow of the company is the backbone of the transaction, then the quality of information is the legs, providing the necessary base for everything. We are always looking at the reliability of this information as it minimizes the risks of inaccuracy and subsequently the risk of default. For example, if borrowers only give internal statements that are hastily prepared and communicate lease details in one-two sentences in an email, this poses a much greater risk than detailed property information in the actual tax return and actual signed lease agreements provided for review. Furthermore, as it pertains to C&I transactions, internally prepared statements rarely reconcile, which makes performing a UCA Cash Flow analysis much more difficult. Tax returns and audited or compiled statements always reconcile, providing an accurate analysis.

Collateral values

As it relates to the property or equipment securing an obligation, an appraisal is always going to be the safest way to measure the value. Too often, internal evaluations or estimates are utilized to justify a request during underwriting. To meet regulatory standards, the collateral securing an obligation must support the amount being considered and obtaining the appraisal during the underwriting phase can potentially save a significant amount of work if the value is insufficient to support the debt. For existing credits that are being refinanced, another important aspect of collateral valuations includes site visits by the account officers. Having photos and notes from the site visit will provide added support to the collateral pledged for the transactions.

Stress testing

Stress testing individual loans during underwriting is becoming increasingly necessary, especially in today’s rising rate environment. This was a regulatory focus back in the late 2010s as there was a rising interest rate environment. Variable rate notes, property values, vacancy rates and ultimately cash flow for debt service were adversely impacted. At the beginning of the pandemic in March 2020, rates dropped markedly and remained flat until just recently. To curb inflation, the Federal Reserve began increasing rates and the extent of the impact on variable rate loans has yet to be determined.

Stressing individual loans at origination provides the institution with a tool to better understand the impact of rate increases on cash flow, property values, and vacancy rates in different scenarios. The result is a more informed credit decision during the underwriting phase. Ultimately, these variables help determine the breakeven point of a business’s cash flow and provide great insight to the actual strength of the primary borrower.

Projections / proformas

These are something that all lenders should request from a borrower/potential borrower to justify the strength of a transaction. However, often these projections will paint an excellent picture of the company and a stellar cash flow that is more than adequate to service the underlying transaction. The intent of requesting and analyzing projections is to compare them to historical results, in many instances where the projected cash flow is higher than historical results. This is typically due to the borrower understating expenses which leads to overstated cash flow and debt service coverage. Given all of this, it is still important to obtain projections and to compare them to actual statements when available. Should they vary significantly, it will open the door to questions and force a deeper look into smaller details such as management of the company.

Y&A Credit Services

Over the past few years, a defined need has developed in the community financial institution industry. Specifically, it has been difficult for financial institutions to hire and retain quality credit professionals, especially in rural areas, to underwrite loans and perform other necessary tasks necessary for adequate credit administration. This need has led Young & Associates, Inc. to create a wholly-owned subsidiary (Y&A Credit Services) to meet the needs of these organizations. Y&A Credit Services has the mission of filling the voids of clients who have limited or even no credit staff to perform these necessary tasks. If your organization has a need for credit underwriting services, please feel free to contact us at 330.422.3482. Our services include spread sheet analyses, annual reviews, full credit underwriting and review of prepared presentations along with a full complement of other credit-related services through Young & Associates, Inc.

Young & Associates introduces Y&A Credit Services, LLC

We are proud to introduce a new line of business through an affiliated organization of Young & Associates, Inc.: Y&A Credit Services, LLC.

Y&A Credit Services is a full-service provider of outsourced underwriting and credit services and offers various commercial underwriting and credit services such as:

  • Commercial credit underwriting and credit approval presentations
  • Annual underwriting reviews
  • Financial statement spreading and analysis
  • Approval and underwriting package reviews

“Y&A Credit Services understands the challenges that financial institutions nationwide face with locating and retaining skilled credit department staff who can efficiently produce trustworthy credit risk management results while supporting an increasing volume of workflow,” said Jerry Sutherin, President & CEO of Young & Associates. “We offer an effective solution to this dilemma by employing our experienced staff, technology, and proven processes to enhance your credit administration process, mitigate credit risk, and ensure continued profitable loan portfolio growth and performance.”

Completely independent from Young & Associates, Inc. and with a name you trust, Y&A Credit Services can help large and small financial institutions increase the quality, accuracy and speed of their lending while mitigating risks in a highly regulated industry. “We are an independent entity, but we offer the same exceptional service, expertise, and integrity you’ve learn to expect from Young & Associates,” says Ollie Sutherin, Principal of Y&A Credit Services.

Visit yacreditservices.com to learn more about the new company and explore the website. And if our services sound like a viable solution to your current challenges, contact Ollie Sutherin by email at osutherin@younginc.com or phone at (330) 422-3453. We would be happy to discuss how we can help your credit department and institution achieve its objectives.

Mergers & Acquisitions Expected to Rebound in 2021

By: Bob Viering, Director of Management
April 2021

The Covid-19 pandemic brought M&A activity for community banks and credit unions to a halt in 2020. All expectations for 2021 are that M&A activity is likely to pick up significantly. Much of this activity is due to organizations that had planned to sell or start acquiring in 2020 to make up for lost time, but it will also be due to the changes in the industry as a result of the pandemic.

Electronic and mobile banking adoption accelerated as financial institutions closed branches or provided limited access during the pandemic. Today, not having a digital banking platform (internet and mobile apps) is no longer an option. Financial institutions need to re-assess branch networks in light of how customers/members bank today. Among the reasons that will drive many organizations to sell are:

  • Long-term impact of low interest rates, today’s compressed margin, and the future impact of rising rates
  • Cost/Liability of data security
  • Regulatory compliance costs
  • Lack of management succession

Conversely, those organizations that have made the technology infrastructure investments, have staffing in place that can succeed in this volatile time, and are comfortable thinking outside the traditional banking box have great opportunities.

How We can Assist
Young & Associates, Inc. has been assisting banks and credit unions for over 43 years and have assembled a team of qualified professionals that can assist you in your acquisition or help you prepare to sell your organization and maximize your return.

The industry is fortunate in that we have many excellent investment bankers, law firms, and accounting firms that provide great advice on the pricing, structure, and regulatory requirements. But as anyone who has been through an acquisition or merger can tell you, it is the knowledge you gain during due diligence and post-merger integration that, in the end, will determine if the transaction was successful. Our services will supplement the services acquired from your investment banker, law firm, and accounting firm.

While due diligence and post-merger integration can be done by your staff, our breadth of knowledge, gained from decades of working for hundreds of banks and credit unions, brings a broader perspective. We deal with many of these issues regularly and can often be more efficient. We also understand that time is of the essence for due diligence and will make your engagement a priority to be completed in the time needed.

Due Diligence Assistance

Loan Due Diligence: We can provide a timely assessment of the underwriting, management, and quality of the target’s loan portfolio. We have experts from all disciplines of lending, including ALLL analysis and credit process. We will help you understand the culture of the organization you are acquiring.

Interest Rate Risk and Liquidity Management Due Diligence: We can assist you in determining the target institution’s level of interest rate and liquidity risk. This can then help you as you consider the combined organization’s level of risk. This will help you answer the following question: “Does the combined organization fit within your risk ‘comfort zone?'”

Compliance Due Diligence: Many aspects of compliance, such as Fair Lending and BSA/AML, will become the acquirer’s problem if there was an issue prior to acquisition. Having the target’s compliance program reviewed prior to closing can help you understand the degree of compliance risk you will be assuming.

IT Due Diligence: This is an often overlooked but critical piece of information to understand how well or what IT-related issues a target bank may have that will need to be addressed post-acquisition.

Strategic Planning: We can help you assess how the acquisition will fit into your strategic direction. If your strategic plan involves potential acquisitions, have you put a plan/process in place to prepare for it, or will you put it together on the fly if an acquisition comes along? Analyzing how the target fits with your culture and your strategic direction is one of the most important aspects of a successful acquisition.

Succession Planning: While much of the attention in an acquisition analysis is on the financial aspects of the transaction, the quality and depth of the human resources of the target institution are the drivers of the target’s current success or challenges. We can assist you with reviewing the target’s succession plan or help you craft a new one for the combined organization.

Interagency Bank Merger Application Assistance

We can assist you with the delineation of the relevant geographic markets, evaluation of competitive factors in the proposed transaction, CRA assessment area data and mapping, demographic information, business environment data, information on traffic patterns, and other relevant market information.

We can also help you craft your business plan that is a required part of the application.

Post-Acquisition Integration
Post-acquisition integration is the key to whether your merger/acquisition is successful. You will have just spent many millions of dollars to buy an organization. Buying the organization is not the end result but the beginning of many months and years of hard work to get the return you expect.

There are several ways we can help you achieve the results you expect from the transaction:

  • Employee and Customer Communications
  • Strategic, Capital, and Succession Plan Updates, based on the combined organization
  • Re-assessment of your Branch Network. Does it make sense to consolidate any branches, especially given the changes that the pandemic has brought along to digital banking adoption?
  • Periodic Loan Review and Compliance Review will allow you to assess the quality of results at both the overall organization and the acquired organization.
  • Analysis of Workflow and Staffing of the combined organization
  • Assessment of your Human Resources Management. Retaining key members of the acquired organization’s staff is often the biggest determinant of future success. This is especially true for your frontline commercial/ag/private bankers and key deposit/cash management personnel who are often the day-to-day face of the organization for your largest customers.

These are just some of the ways Young & Associates can work with you to have a long-term successful acquisition, based on your unique needs. Contact us today for more information on how we can assist you with your M&A efforts.

About Young & Associates, Inc.
Young & Associates, Inc. has provided consulting, training, and practical products for community financial institutions for over 43 years. We strive to provide the most up-to-date solutions for our clients’ needs, while remaining true to our founding principles and goals — to ease the management of your organization, reduce the regulatory burden, improve your bottom line, and increase shareholder value.

To learn more about Young & Associates, Inc. and how we can assist your organization, visit our website or contact Dave Reno, Director — Lending and Business Development.

www.younginc.com
Email: dreno@younginc.com
Phone:330.422. 3455

CRE Portfolio Stress Testing

CRE Stress Testing is widely viewed by bankers and bank regulators as a valuable risk management tool that will assist management and the board of directors with its efforts to effectively identify, measure, monitor, and control risk. The information provided by this exercise should be considered in the bank’s strategic and capital planning efforts, concentration risk monitoring and limit setting, and in decisions about the bank’s loan product design and underwriting standards.

Young & Associates, Inc. offers CRE Portfolio Stress Testing that provides an insightful and efficient stress testing solution that doesn’t just simply arrive at an estimate of potential credit losses under stressed scenarios, but provides a multiple page report with a discussion and summary of the bank’s level and direction of credit risk, to be used for strategic and capital planning exercises and credit risk management activities.
Our CRE Stress Testing service is performed remotely with your data, allowing for management to remain free to work on the many other initiatives that require attention, while we make use of our existing systems and expertise.

For more information, contact Kyle Curtis, Director of Lending Services, at kcurtis@younginc.com or 330.422.3445.

HMDA Data for 2018 Released

By: William J. Showalter, CRCM, CRP, Senior Consultant

The Federal Financial Institutions Examination Council (FFIEC) recently announced the availability of data for the year 2018 regarding mortgage lending transactions at 5,683 financial institutions covered by the Home Mortgage Disclosure Act (HMDA) in metropolitan statistical areas (MSA) throughout the nation.

The newly available HMDA data include disclosure statements for each covered financial institution, aggregate data for each MSA, nationwide summary statistics regarding lending patterns, and the Loan Application Register (LAR) submitted by each institution to its supervisory agency by March 1, 2019, modified for borrower privacy. This release includes loan-level HMDA data covering 2018 lending activity that were submitted on or before August 7, 2019.

The FFIEC prepares and distributes these data products on behalf of its member agencies – the Federal Deposit Insurance Corporation (FDIC), Federal Reserve Board (FRB), National Credit Union Administration (NCUA), Office of the Comptroller of the Currency (OCC), and Consumer Financial Protection Bureau (CFPB) – and the Department of Housing and Urban Development (HUD).

The HMDA loan-level data available to the public will be updated, on an ongoing basis, to reflect late submissions and resubmissions. Accordingly, loan-level data downloaded from https://ffiec.cfpb.gov/ at a later date will include any such updated data. An August 7, 2019 static dataset used to develop the observations in this statement about the 2018 HMDA data is available at https://ffiec.cfpb.gov/data-publication/. In addition, beginning in late March 2019, Loan/Application Registers (LARs) for each HMDA filer of 2018 data, modified to protect borrower privacy, became available at https://ffiec.cfpb.gov/data-publication/.

Data Overview
The 2018 HMDA data use the census tract delineations, population, and housing characteristic data from the 2011-2015 American Community Surveys. In addition, the data reflect metropolitan statistical area (MSA) definitions released by the Office of Management and Budget in 2017 that became effective for HMDA purposes in 2018.

For 2018, the number of reporting institutions declined by about 2.9 percent from the previous year to 5,683, continuing a downward trend since 2006, when HMDA coverage included just over 8,900 lenders. The decline reflects mergers, acquisitions, and the failure of some institutions.

The 2018 data include information on 12.9 million home loan applications. Among them, 10.3 million were closed-end, 2.3 million were open-end, and, for another 378,000 records, pursuant to partial exemptions in the Economic Growth, Regulatory Relief, and Consumer Protection Act (EGRRCPA), financial institutions did not indicate whether the records were closed-end or open-end.

A total of 7.7 million applications resulted in loan originations. Among them, 6.3 million were closed-end mortgage originations, 1.1 million were open-end line of credit originations, and, pursuant to the EGRRCPA’s partial exemptions, 283,000 were originations for which financial institutions did not indicate whether they were closed-end or open-end. The 2018 data include 2.0 million purchased loans, for a total of 15.1 million records. The data also include information on approximately 177,000 requests for preapprovals for home purchase loans.

The total number of originated loans decreased by about 924,000 between 2017 and 2018, or 12.6 percent. Refinance originations decreased by 23.1 percent from 2.5 million, and home purchase lending increased by 0.3 percent from 4.3 million.

A total of 2,251 reporters made use of the EGRRCPA’s partial exemptions for at least one of the 26 data points eligible for the exemptions. In all, they account for about 425,000 records and 298,000 originations.

Demographic Data
From 2017 to 2018, the share of home purchase loans for first lien, one- to four-family, site-built, owner-occupied properties (one- to four-family, owner-occupied properties) made to low- and moderate-income borrowers (those with income of less than 80 percent of area median income) rose slightly from 26.3 percent to 28.1 percent, and the share of refinance loans to low- and moderate-income borrowers for one- to four-family, owner-occupied properties increased from 22.9 percent to 30.0 percent.

In terms of borrower race and ethnicity, the share of home purchase loans for one- to four-family, owner-occupied properties made to Black borrowers rose from 6.4 percent in 2017 to 6.7 percent in 2018, the share made to Hispanic-White borrowers increased slightly from 8.8 percent to 8.9 percent, and those made to Asian borrowers rose from 5.8 percent to 5.9 percent. From 2017 to 2018, the share of refinance loans for one- to four-family, owner-occupied properties made to Black borrowers increased from 5.9 percent to 6.2 percent, the share made to Hispanic-White borrowers remained unchanged at 6.8 percent, and the share made to Asian borrowers fell from 4.0 percent to 3.7 percent.

In 2018, Black and Hispanic-White applicants experienced higher denial rates for one- to four-family, owner-occupied conventional home purchase loans than non-Hispanic-White applicants. The denial rate for Asian applicants is more comparable to the denial rate for non-Hispanic-White applicants. These relationships are similar to those found in earlier years and, due to the limitations of the HMDA data, cannot take into account all legitimate credit risk considerations for loan approval and loan pricing.

Government-backed Lending
The Federal Housing Administration (FHA)-insured share of first-lien home purchase loans for one- to four-family, owner-occupied properties declined from 22.0 percent in 2017 to 19.3 percent in 2018. The Department of Veterans Affairs (VA)-guaranteed share of such loans remained at approximately 10 percent in 2018. The overall government-backed share of such purchase loans, including FHA, VA, Rural Housing Service, and Farm Service Agency loans, was 32.0 percent in 2018, down slightly from 35.4 percent in 2017.

The FHA-insured share of refinance mortgages for one- to four-family, owner-occupied properties decreased slightly to 12.8 percent in 2018 from 13.0 percent in 2017, while the VA-guaranteed share of such refinance loans decreased from 11.3 percent in 2017 to 10.2 percent in 2018.

New Data
The 2018 HMDA data contains a variety of information reported for the first time. For example, the data indicated that approximately 424,000 applications were for commercial purpose loans and approximately 57,000 applications were for reverse mortgages.

In addition, among the 12.9 million applications reported, 1.3 million included at least one disaggregate racial or ethnic category. For approximately 6.3 percent of applications, race and ethnicity of the applicant were collected on the basis of visual observation or surname. The percentage was slightly higher for sex at 6.5 percent.

For the newly-reported age data point, the two most commonly reported age groups for applicants were 35-44 and 45-54, with 22.7 and 22.4 percent of total applications, respectively. Just under 3.0 percent of applicants were under 25 and just under 4.0 percent of applicants were over 74.

Credit score information was reported for 73.1 percent of all applications. Equifax Beacon 5.0, Experian Fair Isaac, and FICO Risk Score Classic 04 were the three most commonly reported credit scoring models at 22.8 percent, 18.8 percent, and 18.2 percent of total applications, respectively. For originated loans, the median primary applicant scores for these three models were between 738 and 746. This compares to medians ranging from 682 to 686 for denied applications.

Debt-to-income ratio (DTI) was reported for 75.3 percent of total applications. Approximately 45.1 percent of applications had DTIs between 36.0 percent and 50 percent, with 7.0 percent of applications with less than 20 percent, and 7.1 percent with greater than 60 percent.

Loan Pricing Data
The 2018 HMDA also contains additional pricing information. For example, the median total loan costs for originated closed-end loans was $3,949. For about 42.5 percent of originated closed-end loans, borrowers paid no discount points and received no lender credits. The median interest rate for these originated loans was 4.8 percent. The median interest rate for originated open-end lines of credit excluding reverse mortgages was 5.0 percent.

The HMDA data also identify loans that are covered by the Home Ownership and Equity Protection Act (HOEPA). Under HOEPA, certain types of mortgage loans that have interest rates or total points and fees above specified levels are subject to certain requirements, such as additional disclosures to consumers, and also are subject to various restrictions on loan terms. For 2018, 6,681 loan originations covered by HOEPA were reported: 3,654 home purchase loans for one- to four-family properties; 448 home improvement loans for one- to four-family properties; and 2,579 refinance loans for one- to four-family properties.

Using the Data
The FFIEC states that HMDA data can facilitate the fair lending examination and enforcement process and promote market transparency. When federal banking agency examiners evaluate an institution’s fair lending risk, they analyze HMDA data in conjunction with other information and risk factors, in accordance with the Interagency Fair Lending Examination Procedures. Risk factors for pricing discrimination include, but are not limited to, the relationship between loan pricing and compensation of loan officers or mortgage brokers, the presence of broad pricing discretion, and consumer complaints.

The HMDA data alone, according to the FFIEC, cannot be used to determine whether a lender is complying with fair lending laws. While they now include many potential determinants of creditworthiness and loan pricing, such as the borrower’s credit history, debt-to-income ratio, and the loan-to-value ratio, the HMDA data may not account for all factors considered in underwriting.

Therefore, when the federal banking agencies conduct fair lending examinations, including ones involving loan pricing, they analyze additional information before reaching a determination regarding institutions’ compliance with fair lending laws.

Obtaining and Disclosing HMDA Data
In the past, HMDA-covered lenders had to make the HMDA disclosure statements available at their home and certain branch offices after receiving the statements. Now, lenders have only to post at their home offices, and other offices in MSAs a written notice that clearly informs those interested that the lender’s HMDA disclosure statement may be obtained on the Consumer Financial Protection Bureau’s website at www.consumerfinance.gov/hmda.

In addition, financial institution disclosure statements, MSA and nationwide aggregate reports for 2018 HMDA data, and tools to search and analyze the HMDA data are available at https://ffiec.cfpb.gov/data-publication/. More information about HMDA data reporting requirements is also available at https://ffiec.cfpb.gov/.

More information about HMDA data reporting requirements is available in the Frequently Asked Questions on the FFIEC website at www.ffiec.gov/hmda/faq.htm. Questions about a HMDA report for a specific lender should be directed to the lender’s supervisory agency.

Connect with a Consultant

Contact us to learn more about our consulting services and how we can add value to your financial institution

Ask a Question